| Table of Contents |
|---|
Draft
This is the initial draft of the design page.
Much of the information here has been pulled from this source document: Promethus-aggregation.pdf
Requirements
- Collect hardware, infrastructure (Linux OS), Hypervisor and Kubelet statistics
- Aggregate (&Silencing) them for consumption
- Via rules
- Provide visualization of statistics
- At site granularity level
- At compute node granularity level.
- Historical level
- By Applying user defined filters
- Counter collection & aggregation service – Offload collection and aggregation at various levels.
- At ONAP level
- At Regional Site level
- At Edge Site level
- Placement decisions based on HPA resource health/availability.
Architectural Components
The following diagram illustrates the key components.
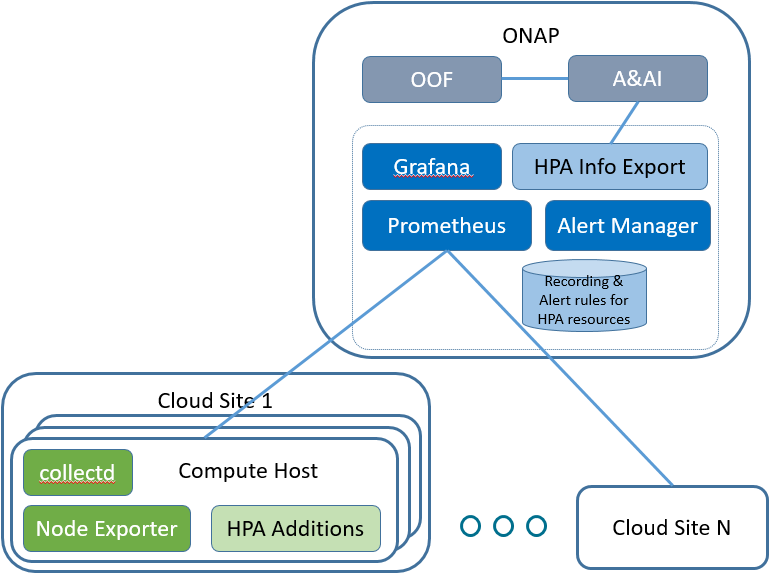
ONAP Components
Prometheus
The Prometheus server is configured to collect time series data from targets. In this case, the source of data will be the compute hosts in the cloud regions.
Alert Manager
The Alert Manager receives alerts based on alerting rules configured for the Prometheus server. Alerts can be forwarded on to clients.
HPA Info Export
For HPA telemetry capture use case, the idea is to create a client to receive alerts from the Alert Manager and update HPA information in A&AI. See HPA - Telemetry OOF and A&AI
Grafana
Grafana is configured to query data from Prometheus and display information on HPA telemetry.
Compute Host Components
There are many projects which can be used to export data to the Prometheus server. The initial components listed here are expected to support an initial list of HPA attributes.
Node Exporter
The node exporter runs on the compute hosts and sends a variety of statistics about the node. Some of these will be used to identify the HPA attributes and capacity of the compute host.
collectd
The collectd component is another exporter that can be executed on the compute host to collect information. collectd has support for SR-IOV information that will be used to support the HPA telemetry.
HPA Additions
It's possible that some HPA attributes may not be supported by any existing exporter. Some additions to existing or new components may be developed to provide support.
Sequence Diagram

Development Phases
Phase 1
The initial phase of HPA Platform Telemetry will involve setting up and operating the basic components.
- Running Node Exporter and collectd on a set of compute hosts
- Setting up Prometheus and Grafana to run in ONAP (e.g. Helm charts, etc.)
- Configuring a set of Prometheus query rules that will expose interesting HPA information
- Configure Grafana to display interesting HPA information pulled from Prometheus
Design topics to resolve:
- Identify methods for doing target discovery - that is, adding compute hosts to the list that Prometheus monitors.
- Identify source, configurations and queries required to capture interesting HPA capabilities and capacities. The initial target list of HPA information is:
- CPUs
- Memory (DDR)
- Disk
- Huge page
- PCIe VFs
Phase 2
With phase 2, the goal is to export HPA information into ONAP A&AI so that OOF can use the data during placement decisions.
Additional components needed:
- Set up Alert Manager
- Develop an HPA Info Export component that can interface with A&AI
Phase 3 and beyond
Some items that could be included here:
- Extend beyond the initial short list of HPA attributes to additional attributes that are relevant to ONAP operations (e.g. Closed Loop)
- A VES Proxy or Exporter capability
- ...