The purpose of this is to measure the load that a complete ONAP platform puts on a Kubernetes multi-node cluster orchestrated and deployed by a Rancher instance. Due to the nature of the deployment in an OOM-based ONAP platform which uses HELM for deployment, it is useful to have a standard set of initial resource requirements so that we know how much should be initially allocated for the Kubernetes node availability so as to not bring the cluster to a failure state due to resource availability concerns.
Rancher’s default Kubernetes template provides three components that have been used here to measure metrics. All of them run on pods within the Kubernetes cluster so the cluster itself can control it:
- Heapster: This is a component that collects metrics and events from all the Kubernetes nodes. It is designed to be modular in a way that multiple backends are supported, such as InfluxDB (used here), Kakfa, ElasticSearch, Google Cloud Monitoring, etc.
- InfluxDB: This is the backend component that Heapster uses to store the collected metric data (i.e. Heapster’s Sink). It is a time-series database that can be queried by many visualization GUIs, including Grafana and Kibana.
- Grafana: This is the frontend component that queries InfluxDB to obtain the metrics collected by Heapster. It can contain many dashboards broken up into panels that can be customized to show all types of data provided by the backend data source.
In order to run these measurements, the following was applied:
- An 11-node Kubernetes cluster (as currently being tested by the Integration team) is suggested to deploy a complete ONAP platform
- Docker version 17.03.2
- Kubernetes version 1.8.10
- A single Rancher instance (v1.6.14)
- Docker version 17.03.2
- Docker version 17.03.2
- The VM flavor for each of these VMs is OpenStack standard flavor “m1.xlarge” which is equivalent to 8 vCPUs, 16 GB RAM, 160 GB HDD
- ONAP "Beijing" Release (Complete, with all components enabled as part of the HELM chart deployment). Gerrit branch "BEIJING"
By using the components to measure resource usage (Heapster), store into a backend component (InfluxDB), and visualizing the data into a frontend (Grafana), the following relevant metrics were collected.
RESOURCE USAGE CHART
These metrics are from Kubernetes resources that do not stop after an amount of time (i.e. Kubernetes Jobs whose container exits as soon as the job request is completed), so focus is on Kubernetes Pods.
NOTE: All the numbers below are assuming that there is no additional actions on the ONAP applications, other than the resources running at an idle state.
- For the complete ONAP instance usage: this is measuring the mean value of overall kubernetes cluster usage after the sum of all the Kubernetes nodes resource usage reports. This takes into account the resource usage of a complete ONAP instance (with all its HELM Charts enabled and deployed).
| RESOURCE | vCPUs | FILESYSTEM | MEMORY (RAM) | NETWORK |
|---|---|---|---|---|
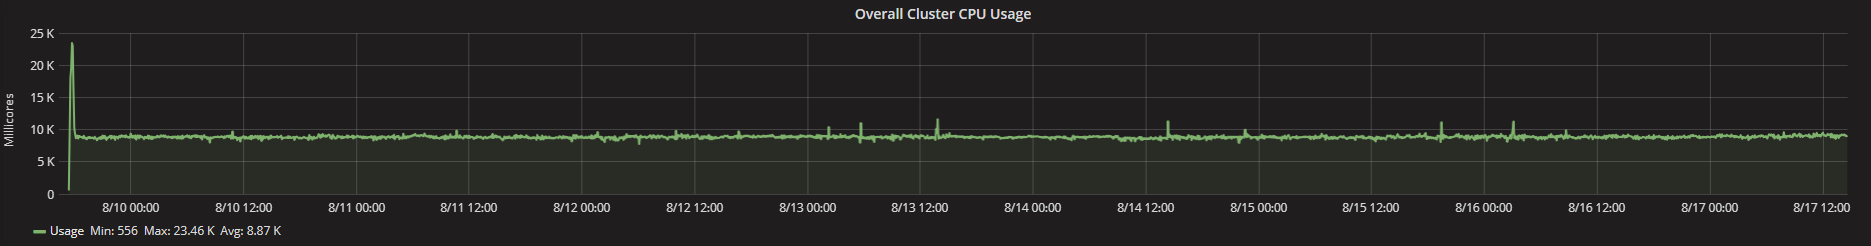
Complete ONAP Instance (All 25 HELM Chart Components - Beijing Release) | Min: 556 mcores Max: 23.46 cores Avg: 8.87 cores | Min: 2.84 GB Max: 25.22 GB Avg: 17.61 GB | Min: 8.5 GiB Max: 130.1 GB Avg: 118.7 GB | Min (Tx / Rx): 293 kBps / 282 kBps Max (Tx / Rx): 2.09 MBps / 9.73 MBps Avg (Tx / Rx): 371 kBps / 341 kBps |
OVERALL CLUSTER - CPU USAGE
OVERALL CLUSTER - FILESYSTEM USAGE

OVERALL CLUSTER - MEMORY (RAM) USAGE

OVERALL CLUSTER - NETWORK USAGE

- For measurement of aggregated pod usage (in other rows):
- There is a TOTAL number of 165 Pods (157 in Running state / 8 in Completed state)
| RESOURCE | vCPUs (mcores) | RAM MEMORY (GiB) | NETWORK (kBps) |
|---|---|---|---|
HELM AAF - Overall Pod Usage
| Min: 7 Max: 22 Avg: 11 | Min: 10.23 Max: 10.68 Avg: 10.43 | Min (Tx / Rx): 1.84 / 2.35 Max (Tx / Rx): 2.22 / 2.84 Avg (Tx / Rx): 2.00 / 2.52 |
HELM AAI - Overall Pod Usage
| Min: 1068 Max: 1635 Avg: 1191 | Min: 10.52 Max: 11.39 Avg: 10.89 | Min (Tx / Rx): 26.64 / 36.31 Max (Tx / Rx): 50.60 / 45.78 Avg (Tx / Rx): 39.79 / 40.69 |
HELM APPC - Overall Pod Usage
| Min: 14 Max: 25 Avg: 17 | Min: 2.71 Max: 2.81 Avg: 2.74 | Min (Tx / Rx): 0.249 / 0.321 Max (Tx / Rx): 0.335 / 0.394 Avg (Tx / Rx): 0.281 / 0.357 |
HELM CLAMP - Overall Pod Usage
| Min: 9 Max: 30 Avg: 13 | Min: 4.26 Max: 4.36 Avg: 4.3 | Min (Tx / Rx): 3.82 / 2.79 Max (Tx / Rx): 4.01 / 5.07 Avg (Tx / Rx): 3.92 / 4.98 |
HELM CLI - Overall Pod Usage
| Min: 0 Max: 0 Avg: 0 | Min: 6.637 MiB Max: 6.641 MiB Avg: 6.639 MiB | Min (Tx / Rx): 0.027 / 0.053 Max (Tx / Rx): 0.045 / 0.064 Avg (Tx / Rx): 0.029 / 0.055 |
HELM CONSUL - Overall Pod Usage
| Min: 408 Max: 514 Avg: 488 | Min: 0.507 Max: 2.49 Avg: 1.14 | Min (Tx / Rx): 44.33 / 758 Max (Tx / Rx): 51.03 / 856 Avg (Tx / Rx): 48.01 / 834 |
HELM DCAEGEN2 - Overall Pod Usage
| Min: (26) + (87) = 113 Max: (40) + (551) = 591 Avg: (30) + (251) = 281 | Min: (2.06) + (4.70) = 6.76 Max: (2.11) + (6.38) = 8.49 Avg: (2.08) + (5.50) = 7.58 | Min (Tx / Rx): (32.12) + (0.951) = 33.07 / (33.03) + (1.63) = 34.66 Max (Tx / Rx): (34.95) + (1.40) = 36.35 / (36.02) + (2.14) = 38.16 Avg (Tx / Rx): (33.50) + (1.09) = 34.59 / (34.49) + (1.80) = 36.29 |
HELM DMAAP - Overall Pod Usage
| Min: 126 Max: 178 Avg: 155 | Min: 2.36 Max: 2.53 Avg: 2.44 | Min (Tx / Rx): 163.30 / 180.25 Max (Tx / Rx): 195.81 / 212.87 Avg (Tx / Rx): 188.81 / 205.66 |
HELM ESR - Overall Pod Usage
| Min: 1 Max: 4 Avg: 2 | Min: 545.6 MiB Max: 570.9 MiB Avg: 555 MiB | Min (Tx / Rx): 0.062 / 0.106 Max (Tx / Rx): 0.076 / 0.120 Avg (Tx / Rx): 0.069 / 0.109 |
HELM LOG - Overall Pod Usage
| Min: 232 Max: 26323 Avg: 3330 | Min: 12.89 Max: 18.62 Avg: 16.30 | Min (Tx / Rx): 6.09 / 31.38 Max (Tx / Rx): 180.82 / 97.80 Avg (Tx / Rx): 36.24 / 44.73 |
HELM MSB - Overall Pod Usage
| Min: 9 Max: 25 Avg: 14 | Min: 657.2 MiB Max: 713.6 MiB Avg: 694 MiB | Min (Tx / Rx): 2.86 / 3.60 Max (Tx / Rx): 3.37 / 4.58 Avg (Tx / Rx): 3.08 / 3.94 |
HELM MULTICLOUD - Overall Pod Usage
| Min: 9 Max: 15 Avg: 13 | Min: 1.14 Max: 1.21 Avg: 1.17 | Min (Tx / Rx): 18.85 / 0.755 Max (Tx / Rx): 21.45 / 0.835 Avg (Tx / Rx): 20.13 / 0.795 |
HELM NBI - Overall Pod Usage
| Min: 7 Max: 10 Avg: 9 | Min: 1.31 Max: 1.72 Avg: 1.57 | Min (Tx / Rx): 0.828 / 0.869 Max (Tx / Rx): 0.849 / 0.904 Avg (Tx / Rx): 0.840 / 0.880 |
HELM OOF - Overall Pod Usage
| Min: 535 Max: 652 Avg: 578 | Min: 10.85 Max: 11.20 Avg: 11.04 | Min (Tx / Rx): 4.72 / 6.39 Max (Tx / Rx): 4.97 / 6.85 Avg (Tx / Rx): 4.88 / 6.68 |
HELM POLICY - Overall Pod Usage
| Min: 8 Max: 26 Avg: 14 | Min: 6.74 Max: 7.33 Avg: 7.07 | Min (Tx / Rx): 12 / 11.14 Max (Tx / Rx): 17.04 / 16.97 Avg (Tx / Rx): 16.11 / 15.15 |
HELM PORTAL - Overall Pod Usage
| Min: 24 Max: 209 Avg: 31 | Min: 10.87 Max: 11.36 Avg: 11.17 | Min (Tx / Rx): 3.80 / 4.84 Max (Tx / Rx): 25.50 / 17.10 Avg (Tx / Rx): 11.06 / 15.41 |
HELM ROBOT - Overall Pod Usage
| Min: 0 Max: 0 Avg: 0 | Min: 5.13 Max: 5.13 Avg: 5.13 | Min (Tx / Rx): 0.027 / 0.053 Max (Tx / Rx): 0.032 / 0.059 Avg (Tx / Rx): 0.029 / 0.054 |
HELM SDC - Overall Pod Usage
| Min: 268 Max: 440 Avg: 309 | Min: 6.68 Max: 11.15 Avg: 8.88 | Min (Tx / Rx): 41.87 / 44.65 Max (Tx / Rx): 86.53 / 91.36 Avg (Tx / Rx): 71.59 / 76.78 |
HELM SDNC - Overall Pod Usage
| Min: 1018 Max: 1032 Avg: 1023 | Min: 2.81 Max: 2.78 Avg: 2.61 | Min (Tx / Rx): 0.707 / 0.855 Max (Tx / Rx): 0.948 / 1.25 Avg (Tx / Rx): 0.407 / 1.16 |
HELM SNIRO-EMULATOR - Overall Pod Usage
| Min: 0 Max: 0.2 Avg: 0.001 | Min: 525.99 MiB Max: 526.08 MiB Avg: 526.05 MiB | Min (Tx / Rx): 0.026 / 0.050 Max (Tx / Rx): 0.030 / 0.061 Avg (Tx / Rx): 0.028 / 0.055 |
HELM SO - Overall Pod Usage
| Min: 5 Max: 34 Avg: 6 | Min: 2.63 Max: 3.77 Avg: 3.15 | Min (Tx / Rx): 1.39 / 1.64 Max (Tx / Rx): 1.71 / 2.69 Avg (Tx / Rx): 1.52 / 1.79 |
HELM UUI - Overall Pod Usage
| Min: 934 Max: 1011 Avg: 991 | Min: 1.35 Max: 1.51 Avg: 1.49 | Min (Tx / Rx): 44.23 / 93.15 Max (Tx / Rx): 48.33 / 101.76 Avg (Tx / Rx): 47.23 / 99.56 |
HELM VFC - Overall Pod Usage
| Min: 395 Max: 462 Avg: 428 | Min: 7.57 Max: 11.32 Avg: 9.56 | Min (Tx / Rx): 0.898 / 1.66 Max (Tx / Rx): 1.04 / 1.83 Avg (Tx / Rx): 0.953 / 1.71 |
HELM VID - Overall Pod Usage
| Min: 3.2 Max: 9.8 Avg: 4.3 | Min: 1.95 Max: 2.15 Avg: 2.05 | Min (Tx / Rx): 0.708 / 0.552 Max (Tx / Rx): 0.846 / 0.648 Avg (Tx / Rx): 0.768 / 0.601 |
HELM VNFSDK - Overall Pod Usage
| Min: 0 Max: 0.2 Avg: 0.001 | Min: 337.9 MiB Max: 355.4 MiB Avg: 348.9 MiB | Min (Tx / Rx): 0.013 / 0.026 Max (Tx / Rx): 0.016 / 0.034 Avg (Tx / Rx): 0.014 / 0.027 |
3 Comments
Brian Freeman
Can you indicate clustering if it was on for any of the components like APPC/SDNC ?
How would we use the per Project Data to "tune" the helm charts so helm does a better initial distribution ?
Maybe add a kubectl -n onap get pods listing ?
Hector Anapan-Lavalle
Hi Brian, sorry I have been working on filling out the numbers and took your advice into account. As you can see in the green table, I am pointing out where there is more than one replica wherever it's doing that. All these definitions are default in the Beijing (ONAP-2.0.0) branch release.
I can also add the complete list of the pods (165 in total) but they are described in the green table next to their respective HELM chart layout.
In order to tune the HELM charts, I would initially say that the HELM charts that have the heaviest loads get priority over deployment than the lightweight charts. Regardless of this fact, an "umbrella" chart like local/onap (holding all ONAP subcharts) will create k8s resources coming from the dependent subcharts, and they are all added up into a single set of k8s resources. Then, this aggregated set of k8s resources are sorted by type (the ordered list by which the k8s resources get deployed is here: https://github.com/helm/helm/blob/master/pkg/tiller/kind_sorter.go#L26).
Michael O'Brien
We are good for Rancher 1.6.18 and Helm 2.9.1
https://lists.onap.org/g/onap-discuss/topic/oom_integration_helm/24628483?p=,,,20,0,0,0::recentpostdate%2Fsticky,,,20,2,0,24628483