App to show networks in a graphical view with basic functions.
![]()
Map and information example
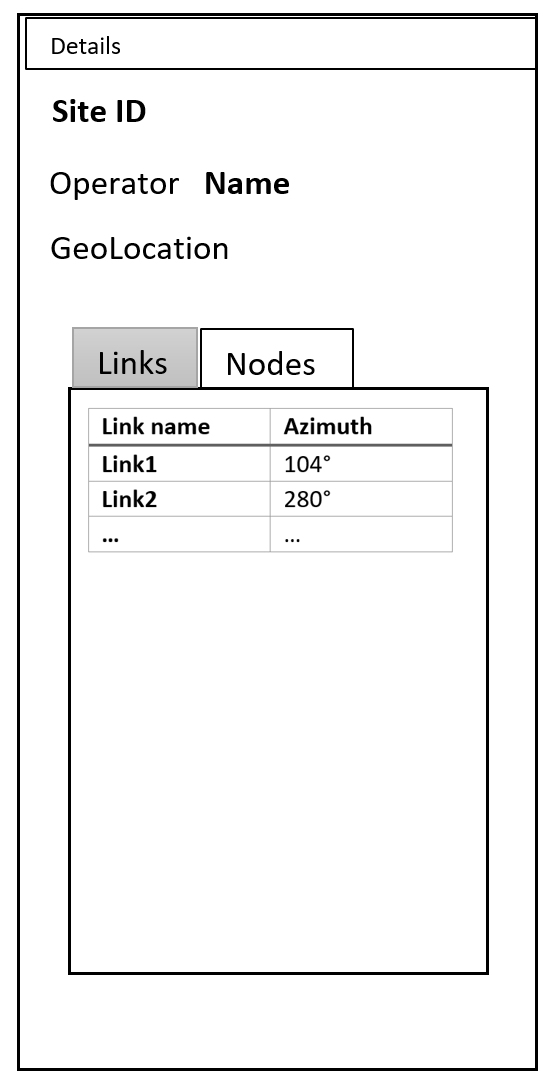
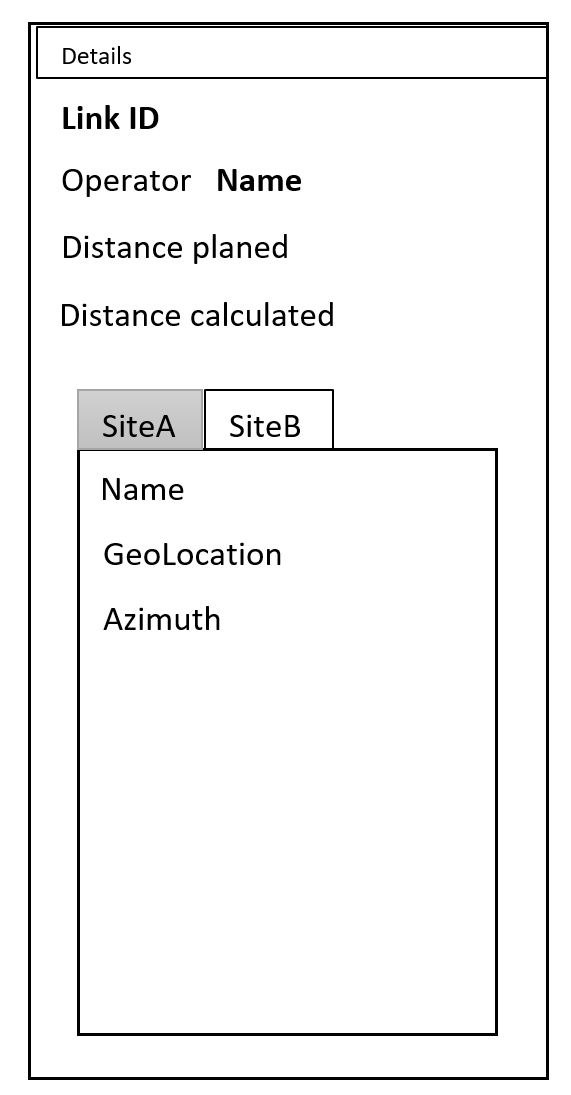
Information (detail) example
To show the details of a given site or link, the right-hand information panel should be used.
As links and sites contain different data, two separate panels are shown below.


If the site details are shown, the user should be able to click on one of the available links (e.g. Link1) in the table, which should open Link1 in the details panel and highlight said link on the map.
It should be possible to navigate back in the details panel. (If Link1 was opened via the details panel, the user should be able to navigate back to the site)
Site or link details can be shared via the current url in the browser window.
Links offer a button to "calculate link". Losses such as obstruction loss are calculated for the given link.
Site type icons
In the Berlin5G network, the type of sites is known. A site might be a high rise building, a data center, a factory or even a street lamp.
If the zoom level is bigger than 11, the normal 'dots', which represent sites, are exchanged by according icons. If the zoom level is smaller than 11, the icons are swapped back to the dots.
The user should be able to activate or deactivate the icons, once they are shown. The user cannot force-show the icons once the zoom level is smaller than 11.
If the site data has no type information, the icons are not swapped.
Additional map functionality
The map should offer a search bar to search sites or links by name. If a site/link was found, the map should center on the element and show its details.
The map offers an infobox in which the currently visible and total number of links and sites are shown.
Topology-api-server availability
The backend for the network map, the topology-api-server, will be hosted outside of sdnc. Accordingly, the network map has to check if a connection to the server can be established.
If the connection can be established, no info is needed as the tiles and model data load.
If the connection cannot be established, a suitable info text + icon should appear on the map.
URL
centering map
If latitude, longitude and zoom values are passed in via the url, the map should center on that location.
If the latitude, longitude, zoom part is removed from the url, the map should stay at its former location.
working with details
If a site or link are passed in via the url (via details), the details panel should load the information. The detail-element should be highlighted on the map and the map re-centered accordingly.
If no site nor link with such a name can be found, the details panel should show an error message.
If the details part of the url is removed, the details panel should change to an empty state.
![]()
Originally, the link calculation should have been included in the network map.
After further discussions, the decision was made to move the link calculation functionality into a new app.
The ODLUX Link Calculator accesses the topology-api server to do its calculations.
odluxurl/{lat},{lon},{zoom}*/details/{detailsName}
*the zoom is optional. If no zoom was passed, a default zoom of 11 should be used
The URL can be set manually by the user. The map and details panel will adjust accordingly.
When the map stops moving or a details element, either link or site, is loaded, the URL gets updated automatically.
| Use case | description |
|---|---|
| Browse network | Present a network in map
|
| Link calculation |
|
Implementation
Integration test
Assumed schedule
Points to cover