DMaap Simulator is a simple Spring Boot application, which exposes two endpoints. First endpoint (@PostMapping("/events/unauthenticated.SEC_FAULT_OUTPUT")) which receives fault events topic and second (@GetMapping("/summary")) which display events count and average processing time in milliseconds(depending on "startEpochMicrosec").
JMeter is generating the current epoch (current time) and updates this field:

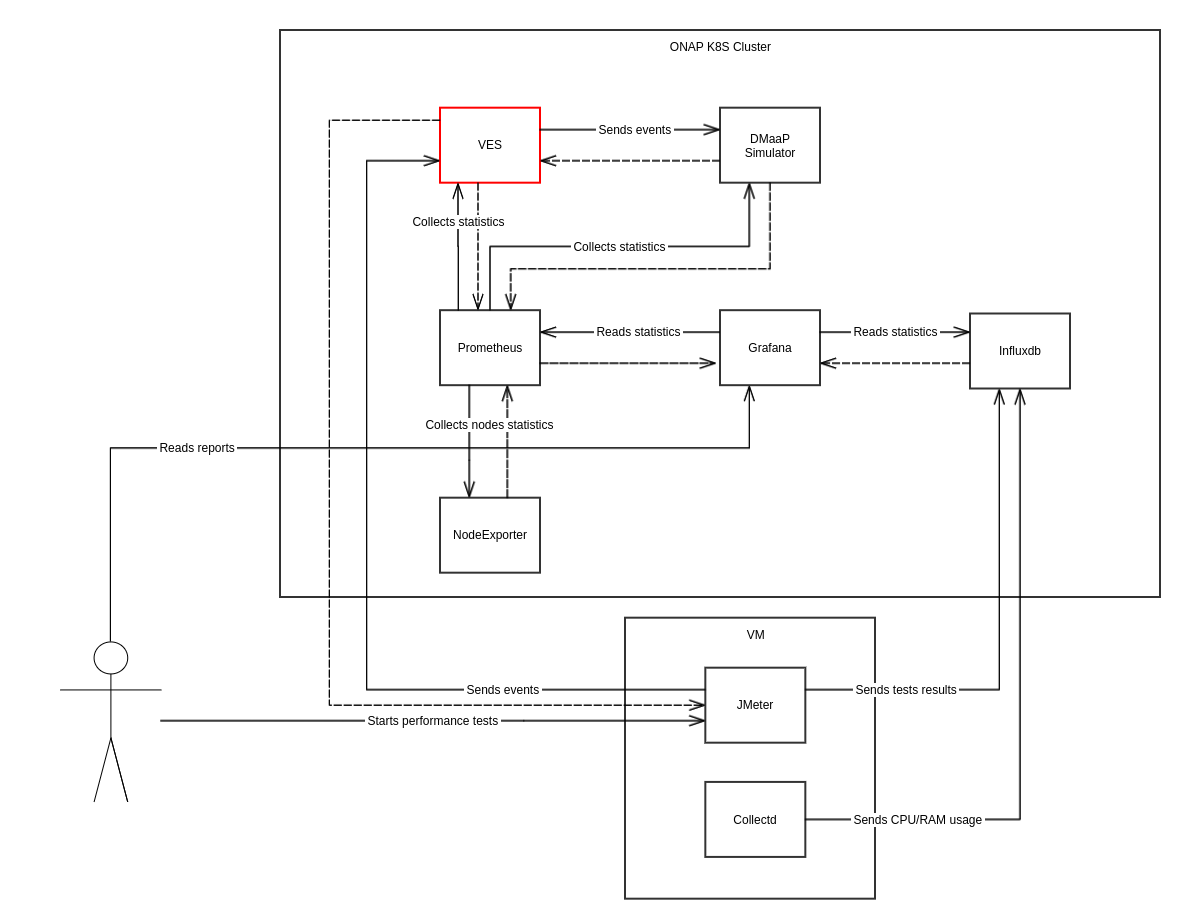
Architecture

DMaap Simulator image:
DMaap Simulator supports VES collector in the Frankfurt release.
| Test scenario | Description | JMeter test results & metrics | Ves metrics | K8s metrics |
|---|---|---|---|---|
1_test_scenario_6_steps.jmx |
|  |  |  |
2_test_scenario_1k_rps.jmx |
|
|
|
|
2_test_scenario_2k_rps.jmx |
|
|
|
|
2_test_scenario_3k_rps.jmx |
|
|
|
|
| 2_test_scenario_4k_rps.jmx |
|
|
|
|
2_test_scenario_5k_rps.jmx |
|
|
|
|
| custom |
|
|
|
|
| custom |
|  |
|
|
| custom |
|
|
|
|
| custom |
|
|
|
|
| Test scenario | Description | JMeter test results & metrics | Ves metrics | K8s metrics |
|---|---|---|---|---|
| custom |
|
|
|
|
| custom |
|
|
|
|
| custom |
|
|
|
|
| custom |
|
|
|
|
| custom |
|
|
|
|
| custom |
|
|
|
|
| custom |
|
|
|
|
| custom |
|
|
|
|
| custom |
|
|
|
|
| Test scenario | Description | JMeter test results & metrics | Ves metrics | Ves additional metrics |
|---|---|---|---|---|
| custom |
|
|
|
|
| 3_test_scenario_50_rps_time_600.jmx | 50RPS → 10min |
|
|
|
| 3_test_scenario_50_rps_time_600.jmx | 50RPS → 10min |
|
|
|
| 3_test_scenario_50_rps_time_600.jmx | 50RPS → 10min |
|
|
|
| 3_test_scenario_100_rps_time_600.jmx | 100RPS → 10min |
|
|
|
| 3_test_scenario_100_rps_time_600.jmx | 100RPS → 10min |
|
|
|
| 3_test_scenario_100_rps_time_600.jmx | 100RPS → 10min |
|
|
|
Ves version : 1.9.1
| 3_test_scenario_50_rps_time_600.jmx | 50RPS → 10min |
|
|
|
| 3_test_scenario_50_rps_time_600.jmx | 50RPS → 10min |
|
|
|
| 3_test_scenario_50_rps_time_600.jmx | 50RPS → 10min |
|
|
|
| 3_test_scenario_100_rps_time_600.jmx | 100RPS → 10min |
|
|
|
| 3_test_scenario_100_rps_time_600.jmx | 100RPS → 10min |
|
|
|
| 3_test_scenario_100_rps_time_600.jmx | 100RPS → 10min |
|
|
|
Environment
| Average and Max Sync Processing Time (Client → VES) | Average VES Processing time | Error Rate [%] | Max CPU Usage [%] | |||
|---|---|---|---|---|---|---|
| VES with Dmaap | 50th percentile | 95th percentile | 99th percentile | |||
| 50RPS → 10min | 122ms, 349ms | 181ms, 3.23s | 591ms, 4.43s | 91ms | 0 | 36 |
| 124ms, 515ms | 204ms, 4.27s | 609ms, 5.48s | 90ms | 0 | 42 | |
| 121ms, 399ms | 177ms, 2.17s | 561ms, 5.22 | 91ms | 0 | 30 | |
| 100RPS → 10min | 274ms, 7.06 | 570ms, 7.93s | 1.0s, 8.06s | 139ms | 0.05% | 72 |
| 574ms, 6,07s | 1,17s, 14.19s | 1.89s, 15.37s | 201ms | 0 | 91 | |
| 291ms, 5.88s | 415.5ms, 6.45s | 922ms, 11.3s | 143ms | 0 | 78 | |
| VES with Cambria | 50th percentile | 95th percentile | 99th percentile | |||
| 50RPS → 10min | 118ms, 520ms | 174ms, 2.10s | 571ms, 6.48s | 90ms | 0 | 48 |
| 122ms, 548ms | 230ms, 5.17s | 581ms, 5.54s | 88ms | 0 | 32 | |
| 123ms, 557ms | 194ms, 2.50s | 676ms, 5.12s | 88ms | 0 | 42 | |
| 100RPS → 10min | 301ms, 5.79s | 772ms, 16.97s | 1.16s, 17.08s | 153ms | 0 | 88 |
| 340ms, 7.13s | 636ms, 17.87s | 1.15s, 18.48s | 149ms | 0 | 76 | |
| 307ms, 8.29s | 506ms, 9.44s | 855ms, 9.78s | 155ms | 0 | 88 | |
Results of performance tests for both VES collector client implementation (DMaap client and Cambria client) are very similar.
Max CPU usage, Error rate, Average VES processing time, average and max sync processing time(Client → Ves) are almost the same.
In Ves collector with DMaap client(100RPS for 10 min), appeared an error with the connection pool. In that specific case, we had a connection poll set to 16 and we got an error that the connection poll limits have been reached (stack trace in attachment).
We have to handle that kind of error in code.


.png")


.png")


