...
Data Requirements (logstash)
Kibana Preparation
Kibana
...
Objects Import
How To Use
1. Open Dashboard "Culprit Locator (Component Level)" and adjust the time picker for the parts you're interested in or choose one like "Last 7 days". The dashboard features:
- Pie-in-pie chart shows the total log counts of components for each log level
- Log tracking visualization across the components over time: each box represents a collection of logs for the time slot highlighting the most severe loglevel using a color scheme (see the legend in the title of chart, e.g., a red box indicates that at least one ERROR log exists in the time slot). On this chart, you can zoom in any specific time frame by mouse dragging, or click any box to drill down the logs in there
- Table of ERROR logs and the components involved with them. Each Error record provides a link (displayed as "view") to a separate drill-down dashboard based on the timestamp of the error.
- Table of all relevant logs at all loglevel (to see that, need to scroll down the dashboard)

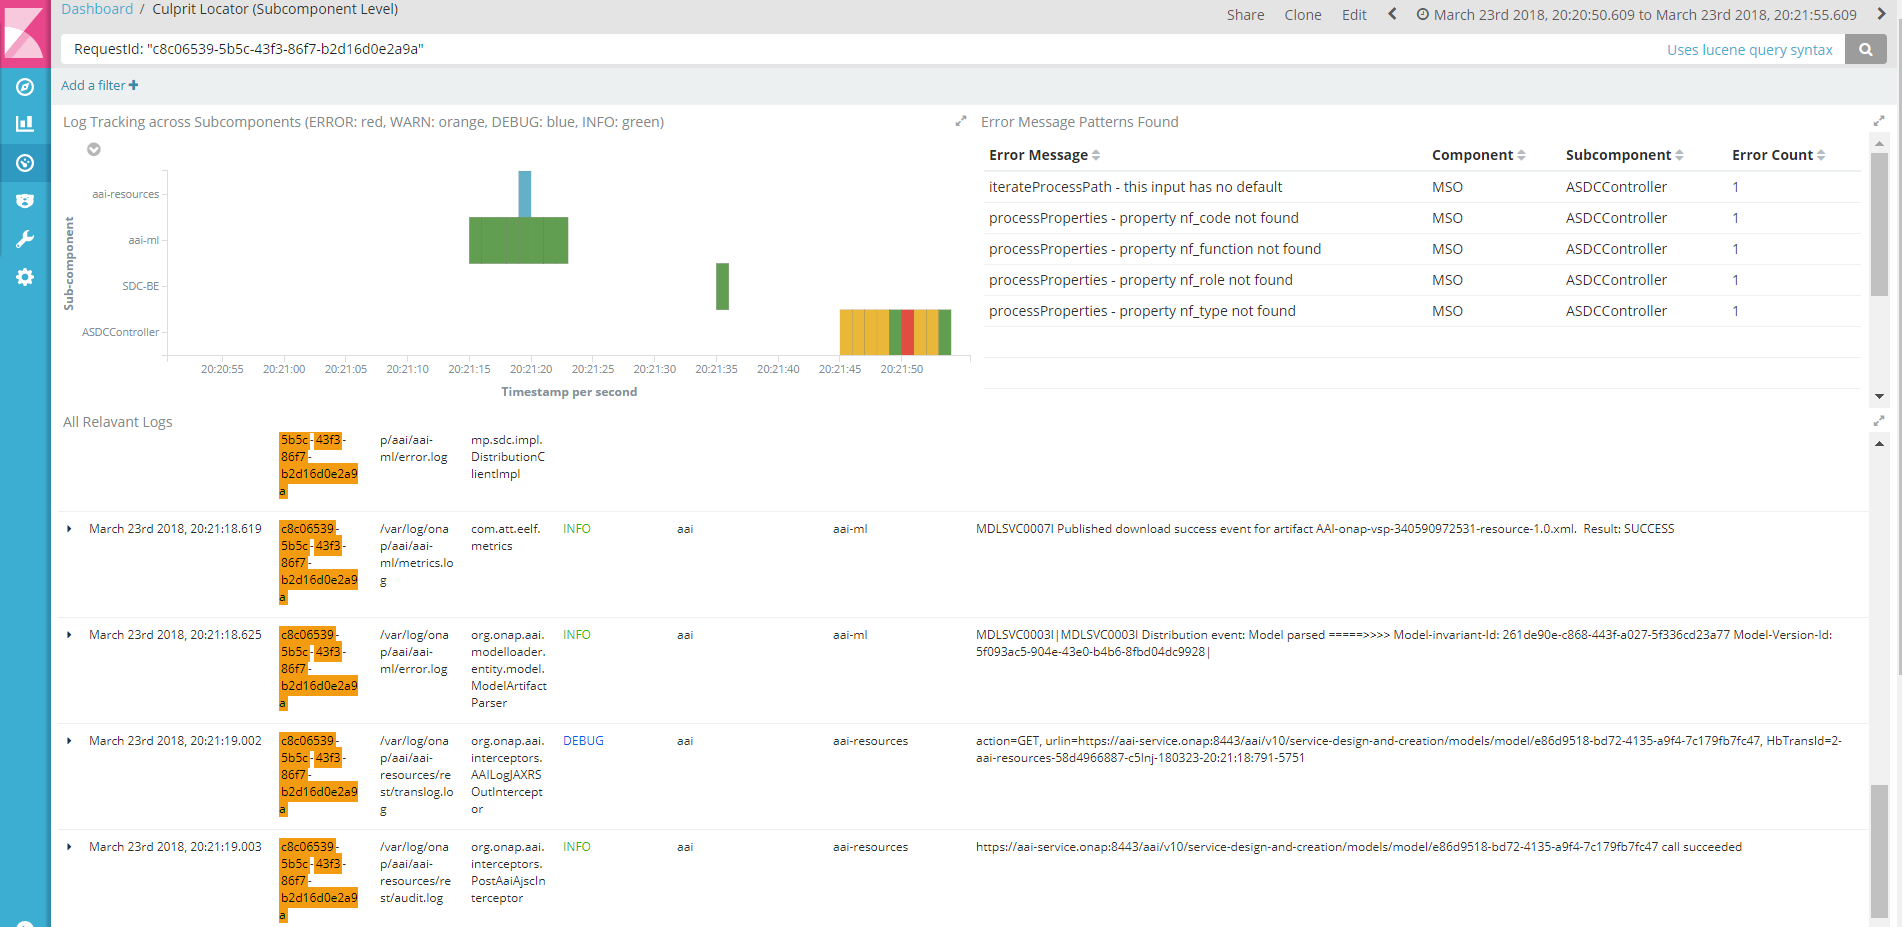
2. Drill-down (or more focused) view dashboard automatically opens as a separate tab with time perid set ranging from -60 seconds prior to the error time to +5 seconds after the error occurred. The user can still zoom in or click the boxes. The dashboard features:
- Log trracking by sub-components over time with the same color scheme with the previous dashboard
- Table of error message patterns categorizing all diffeerent error messages (to be imporved)
- Table of all relevant logs at all loglevel, scrollable for investigating the logs for the specified time period
User Guide
Improvements
...