...
- Rationale
From the service/network operator perspective, the BPMN Monitoring has been realized as a pain point since the Amsterdam release. "Finding right process instance(s) and data for the service / resource request is tedious and hassle."
- Camunda is not an OSS vendor, and they don't have any business value to cover the OSS opearator-friendly monitoring.
There is Camunda cockpit, but regardless community or enterprise editions, they were designed from a BPMN process management perspective.
- They require the user BPMN definition and design knowledge for monitoring.
- The user needs to know which service invokes which BPMN process definitions and how those process definitions are related to each other.
- There could be thousands process instances daily, and a top-level process instance can have multiple sub-process instances (call activity instances).
- It is not easy to find right process instances and data
- We need more than what Camunda Community/Enterprise editions offer to
- Facilitate the finding of associated process instances and data
- Allow VID, UUI or external application users monitor process workflow process (graphically and text-based) based on their search criteria.
- Bypassing all the tedious manual search through process definitions and instances
- Eliminating prerequisite knowledge of process definition relationships for monitoring - learn as you drill down and up
- Needs drill down and drill up to cover sub-process instances graphically and text-based.
- Troubleshooting workflows
- Facilitate the finding of associated process instances and data
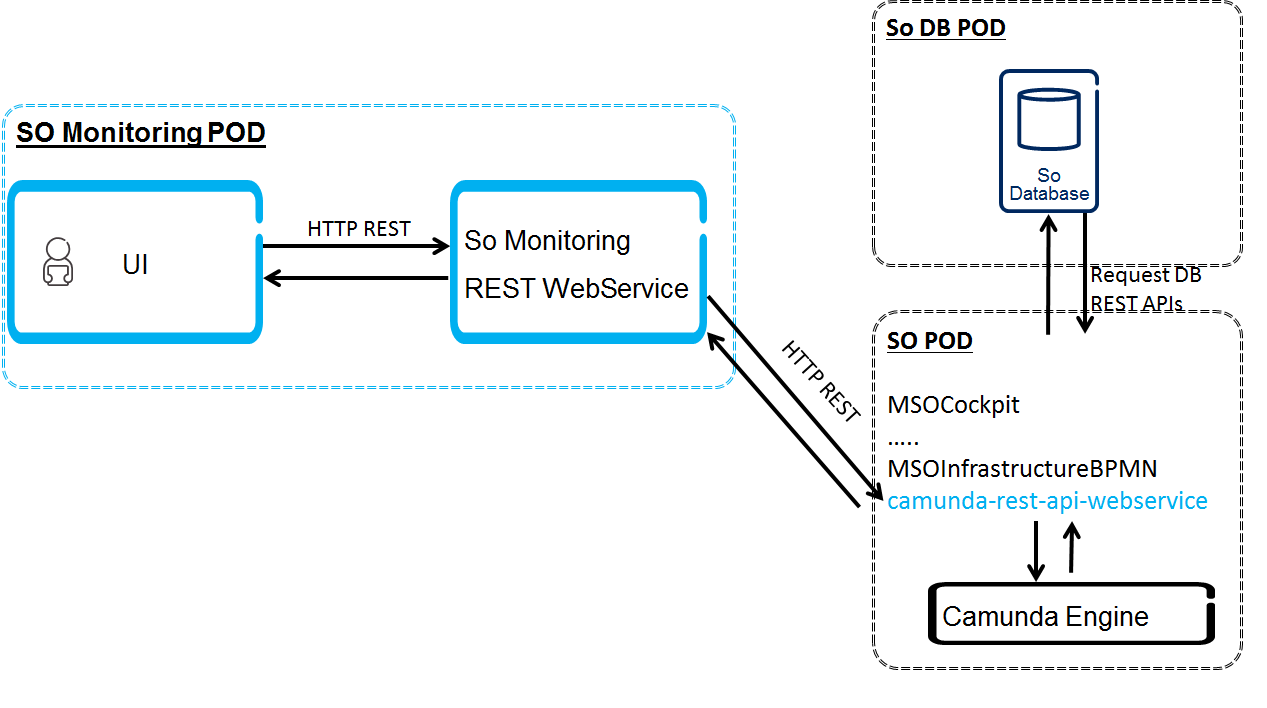
- The following diagram depicts the high-level concept.
...
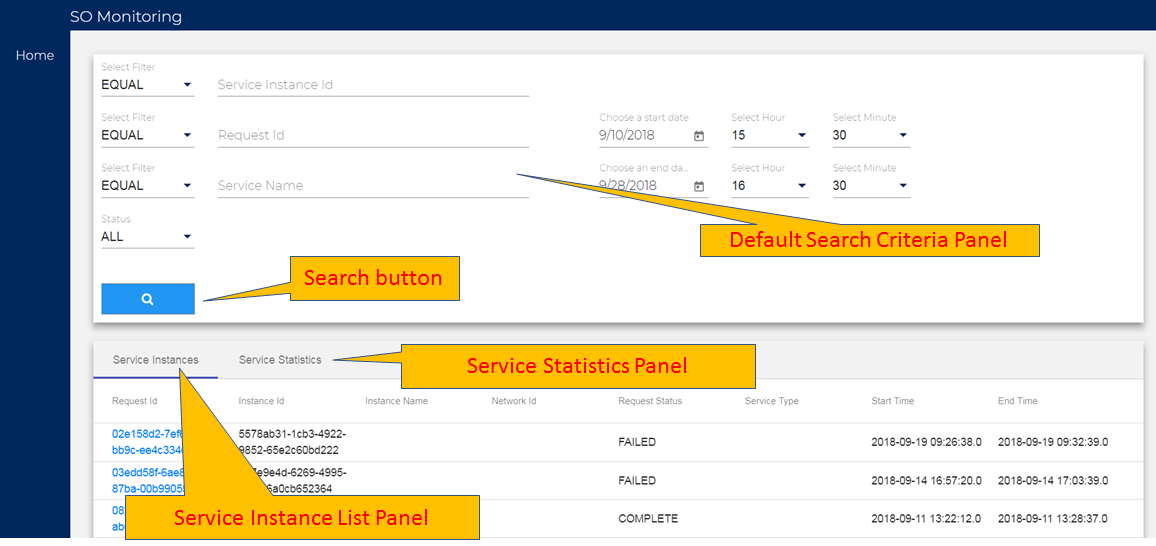
- Widget Requirements and Design
- *** Note 1: actual screen layout and display can be changed based on implementation decisions. ***
- *** Note 2: the service list panel columns can be changed based on the database table columns. The important fields would be the request id / service instance id, requester id, date/time for filtering.***
- *** Note 3: we can add a new field, Proc_Inst-ID varchar(64) to the Infra_Active_Requests database table, to associate it (as a top-level process instance id) with the service instance id
- Service List Widget
- Capabilities
- Provides monitoring capabilities for processed services based on search criteria
- Configurable Search Criteria filtering: Service ID, Operation Type, Status, User Id, Date/Time range
- Actual filtering criteria fields could be changed based on configuration
- The Service List panel will display the filtered Service list.
- This widget can be triggered from other UIs (VID, UUI, external applications).
- Provides monitoring capabilities for processed services based on search criteria
- Design
- The search criteria fields will be defined in a search criteria field configuration file (e.g., so-monitoring-config.yaml). So, they can be customized and support internationalization.
- Based on the fields and buttons configuration, the Service List widget will render the corresponding fields and buttons.
- The search criteria fields support the field validation based on the field type; e.g., length, date format, time format.
- The Service List panel supports pagination, which will be controlled by the Navigation buttons.
- Queries a service list from the SO Request DB through the Monitoring REST APIs.
- Action buttons are enabled/disabled based on data population and/or context.
- The wild characters are supported for the Search fields.
- Note: for security (who, when and how access info), the requester info (User Id) is needed. It could be a future requirement.
- The flexible filtering expression could be a stretch goal (it depends the BE Request DB query capabilities)
- Capabilities


- Capabilities
Example of so-monitoring-config.yaml // note: the flexibility depends on the SO - Capabilities
service-list-search-criteria-fields:
user-id:
name: User Id
type: String
max-length: 30
validation: alpha-numeric
service-id:
name: Service Id
type: String
max-length: 30
validation: alpha-numeric
operation-type:
name: Operation Type
type: String
max-length: 30
validation: alpha-numeric
status:
name: Status
type: combo-list
max-length: 30
default-value:
- status-item: finished
name: Finished
- status-item: processing
name: Processing
- status-item: error
name: Error
date-from:
name: Date From
type: date
validation: date-format
time-from:
name: Time From
type: time
validation: time-format
date-to:
name: Date To
type: date
validation: date-format
time-to:
name: Time To
type: time
valiation: time-format
filtering-expression:
name: Filtering Expression
type: string
validation: regular-expression
action-buttions:
search:
name: Search
statistic:
name: Statistic
monitor:
name: Monitor
previous:
name: Previous # or <--
next:
name: Next # or -->
service-list:
max-row: 25000
service-instance-rendering-details:
max-page-num: 10
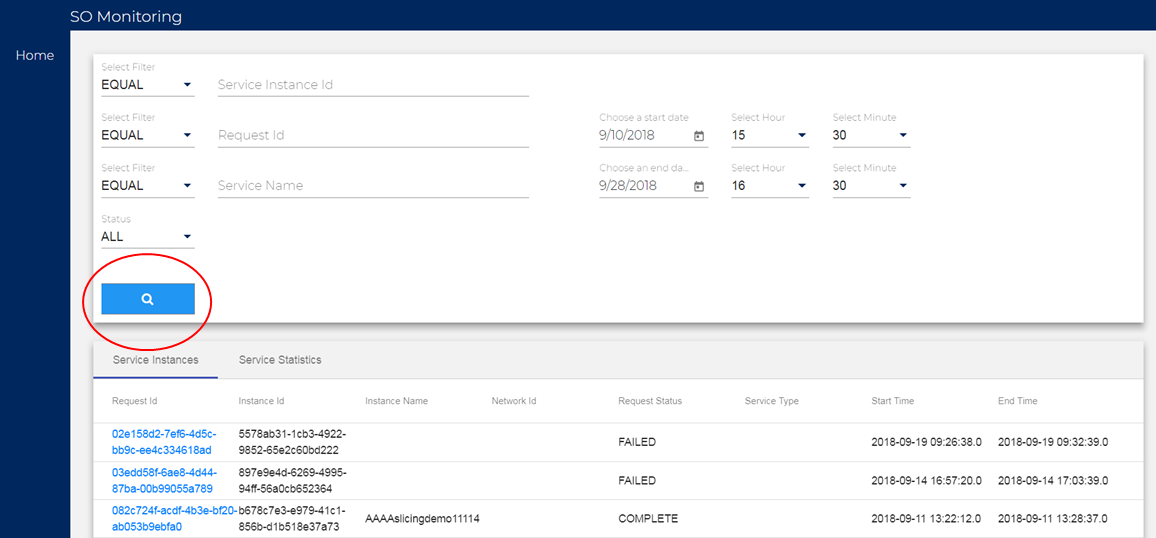
- Capabilities
- After the user fills up the desired search crtieria fields, and click the Search button.

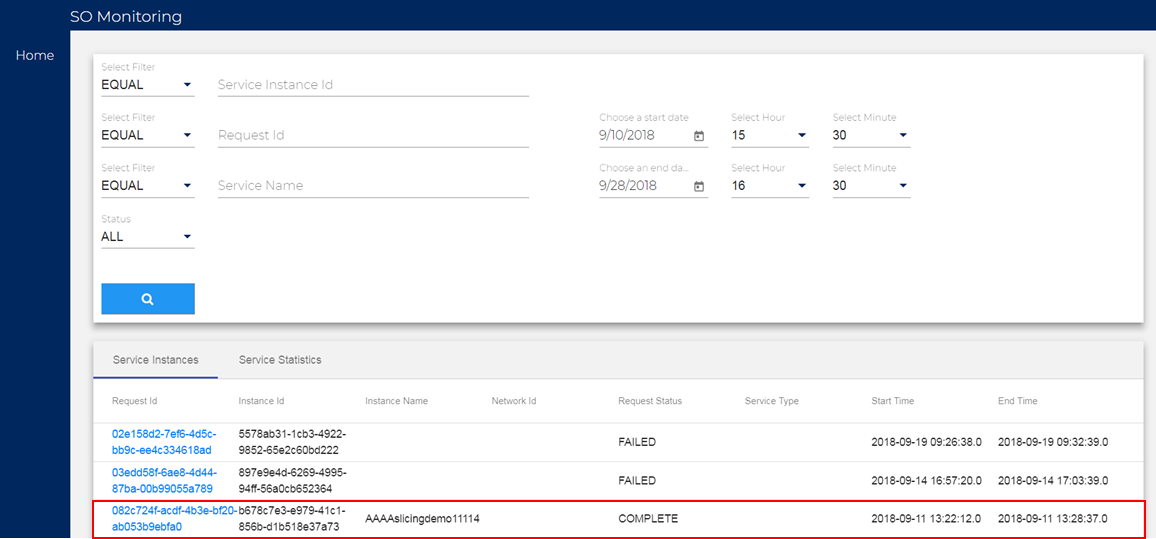
- when a user clicks on a row, highlight the selected row and enable the Monitor button.
- Once the Monitor button is clicked, go to the process / Service Instance Rendering and Deail widget, passing key fields such as process / service instance id, which will be mapped into the process instance id to find a matched process instance id in Camunda database in the Service Instance Rendering and Detail widget.


- Design
- Query for service list data for a given search criteria.
- Count the total number per status (Finished, Processing, Error)
- Status Total / total number
- Query for service list data for a given search criteria.


- use Camunda REST API, GET /process-defintion/{id}/xml
- Get the state of a process instance from the activity-instances
- Use Camunda REST API, get/process-instance/{id}/activity-instances
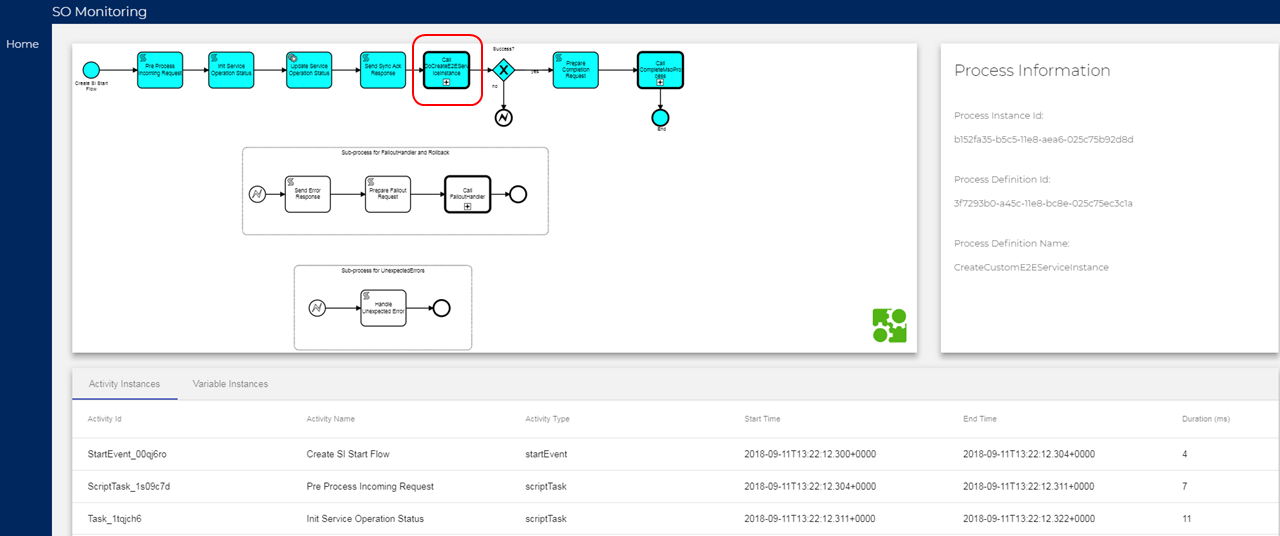
- Render the BPMN XML with bpmn.io (or equivalent) and places markers on top of it, and provide process / Service instance detail views.
- Design
- This widget will be on the secondary/pop-up browser page.
- The Service List page will be the primary page, so the user can open multiple Process / Service Instance Rendering and Detail pages.
- The search criteria fields are for display only, and they cannot be changed.
- The Detail panel is scrollable and display contents with the tag: value formt.
- Query a process instance with the matched 'serviceInstanceId' process variable.
- get a process instande id: query bases on the process variable,
- GET /history/variable-instance/{variableValue}, where {variableValue} = 'serviceIntanceId' ;
- query BPML XML based on a process instance id
- GET /process-definition/{id}/xml
- query the process instance detail such as process variables
- GET /process-instance/{id}/variables
- Display the process variables on the Process / Service Instance Detail panel
- query and activity instance (tree) for the process instance id
- GET /process-instance/{id}/activity-instances
- GET /history/activity-instance/{id}
- The response provides child activity instance info. By using this we can find the parent and child process instnce id and definition id.
- If the current process instance id has its parent, enable the Drill-Up button.
- When a user clicks on a task, display the task varables
- GET /task/{id}variables
- When the task activity type is call activity, it enables the Drill-Down button.
- get a process instande id: query bases on the process variable,
- Render the process instance diagram with the retrieved XML.
use bpmn.io javascript library for the XML rendering and event attachments for process instance tasks.
- This widget will be on the secondary/pop-up browser page.
...
- The Close button is always enabled.


- The following is a possible alternative process / service instance rendering based on the Camunda Cockpit screen. If we go this path, the Camunda Cockpit customized plugin would be used. This path was NOT chosen.
- Calling the process instance cockpit page
get the processInstanceId from the getProcessInstanceId(String serviceInstanceId).
call the process instance cockpit page, e.g., following a function like below:
$scope.getProcessInstanceUrl = function(processInstance, params) {
  var path = '#/process-instance/' + processInstance.id;
  var searches = angular.extend({}, ($location.search() || {}), (params || {}));

  var keepSearchParams = [ 'viewbox' ];
  for (var i in params) {
    keepSearchParams.push(i);
  }

  return routeUtil.redirectTo(path, searches, keepSearchParams);
};
...
- Task Drill-Down/Drill-Up and Detail View
- Capabilities
- Support Task (Call Activity) drill-down/drill-up capabilities.
- When a call activity task is selected, the Drill-Down button will be enabled.
- Provide detail views for the selected Task.
- When a task is selected including the call activity, the Detail view panel will display details for the selected task.
- Design
- When a selected/clicked task activity type is the Call Activity, the Drill-Down button is enabled.
if (activityType.equals('CallActivity') {enableDrillDown();}
- If the current process instance has its parent process instance (from the activity tree), the Drill-Up button is enabled.
- if (parentActivityInstanceId != null) {enableDrillUp();}
- When a selected/clicked task activity type is the Call Activity, the Drill-Down button is enabled.
- Capabilities
- Task Drill-Down/Drill-Up and Detail View

- Sub-Process/Service Instance Rendering and Detail View
- Capabilities
- Get a sub process defintion XML through the Service Id and Process Instance association.
- Use Camunda REST API, get/process-definition/{sub-id}/xml
- Get the state of a sub-process instance from the activity-instances.
- Use Camunda REST API, get/process-instance/{sub-id}/activity-instances
- Render the BPMN XML with bpmn.io and places markers on top of it, and provides process/service instance detail views.
- This widget uses the same code of the Process/Service Instance Rendering and Detail View with the sub-process instance id.
- The Drill-Up button will be enabled.
- Design
- This widget code is the same as the Process/Service Instance Rendering and Detail.
- The difference is the passed process id; the child process instance id will be passed.
- Capabilities
- Sub-Process/Service Instance Rendering and Detail View


- REST APIs for providing data to UIsfor providing data to UIs (note: actual code will be different based on the implementation decisions
- Capabilities
- Provides REST services, by utilzing 1) Camunda REST APIs, such as BPMN XML string, process activity data, process variable, statistic, and 2) SO Request DB APIs for a service list.
- Consolidate data responses from multple Camunda calls (both from process and history database) and feed them to UIs.
- Use of HistoryService APIs, example, processEngine.getHistoryService().createHistoricProcessVariableQuery().xyz
- Set a History level to ACTIVITY as a minimum; AUDIT (default) level for process variable tracing; currently, it is set to FULL
- ProcessEngine processEngine = ProcessEngineConfiguration.createProcessEngineConfigurationFromResourceDefault().setHistory(ProcessEngineConfiguration.HISTORY_FULL).buildProcessEngine()
- Provides workflow tracing (between parent-child workflows, interaction with other services; service task in and out); example,
- processEngine.getRuntimeService().createExecutionQuery().processVariableValueEquals("serviceInstanceId", serviceInstanceId).singleResult();
- Custom Query
- Custom Query against History ACT_HI_DETAIL database table, as needed
- Create a REST API, getServiceList with search criteria
- invoke getInfraRequest(...) to collect service list data based on search criteria.
- or use the RequestDB adapter directly.
- Design
- Write REST APIs in the new mso-api-handlers/mso-api-handler-monitoring
- The following APIs are out-dated. Look at the SO-Monitor-APIs for Implementation detail, SO Monitoring API
- Capabilities
- getServiceList(Map searchCriteria...) // invokes new getInfraRequest(Map searchCriteria...)
- getServiceStatistic(Map searchCriteria, String status); // get the statistic percentage for the status
- getProcessInstanceId(String serviceInstanceId); // get the processInstanceId through GET /history/variable-instance/{id}
- getprocessDiagramXML(String processInstanceId); // get a process instance, get a process definition id, and get diagram
- getprocessInstanceDetail(String processInstanceId);
- getHistoryActivityInstance(String processInstanceId); // GET /history/activity-instance?processInstanceId={processInstanceId}
- getProcessInstanceParent (String processInstanceId);
- getProcessInstanceChildren(String processInstanceId);
- getProcessTaskDetail(String processInstanceId, String taskId);
- getProcessTaskType(String processInstanceId, String taskid); // query if this task type is "Call Activity" for drilling down
- The following diagram depicts the API interaction.

...
...
- Component Build Dependencies
- The following diagram depicts the component build dependencies.
- Components can be built in parallel with a certain level of sequential integration.
- Each estimate includes code development and unit testing plus some component integration and integration testing (since there are API dependencies).
...
- Estimates (T-Shirt Size: M)
- Note:
- It is a rough estimate - to be refined
- Estimate includes development and unit testing time
- As mentioned in the above section, the components can be built in parallel.
- 5 hours / day
- Note:
...
Priority
...
Component
...
Development Estimate
...
Priority | Component | Development Estimate | Comments |
|---|---|---|---|
| 1 | REST APIs for providing data to UIs | 40 hours / Java developer |
|
| 2 | SO Service List widget | 60 hours / UI developer |
|
| 3 | Process/Service Instance Rendering and Detail Panel | 60 hours / UI developer |
|
| 4 | Statistic Dashboard (stretch goal) | 40 hours / UI developer |
|
| 5 |
|