Versions Compared

Key

  • This line was added.
  • This line was removed.
  • Formatting was changed.

...

Expand
titleClick here to see results...

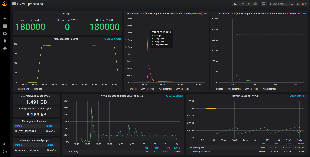
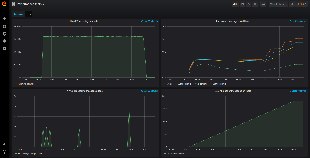
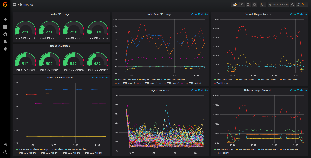
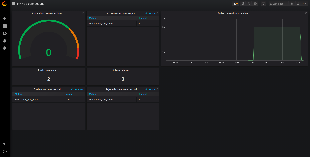
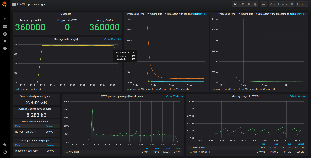
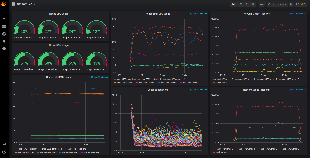
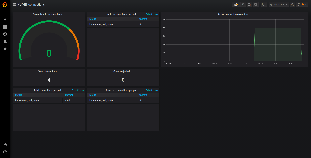
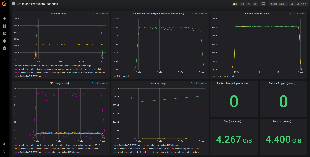
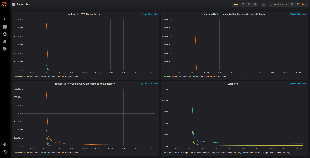
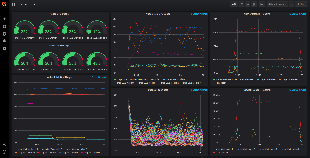
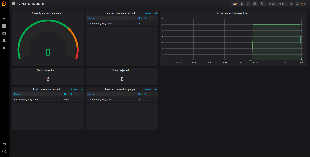
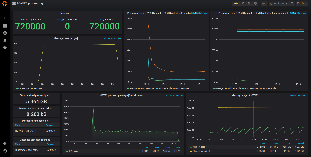
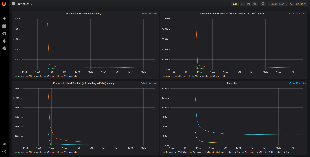
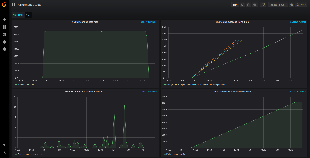
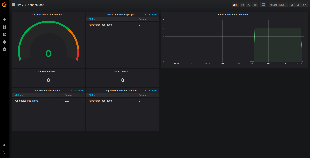
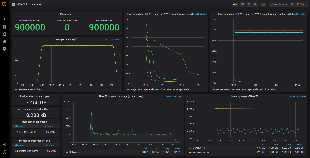
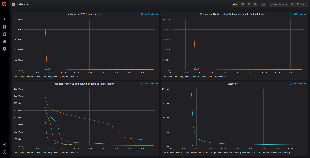
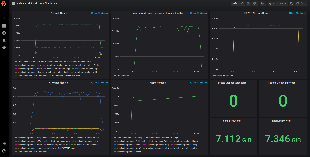
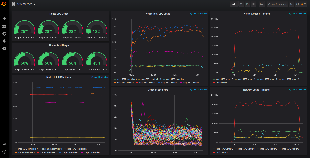
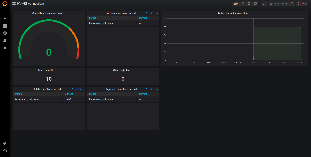
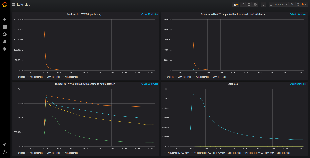
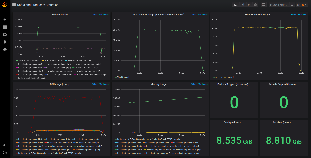
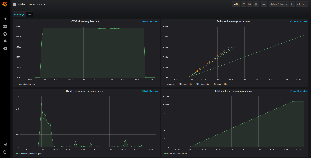
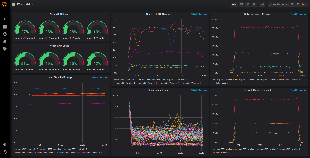
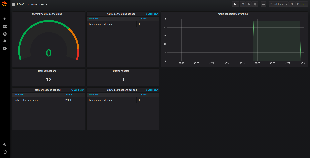
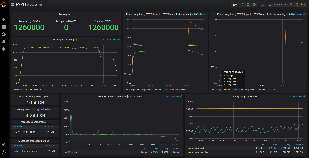
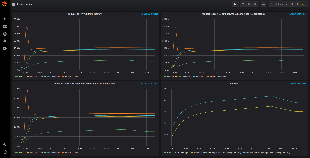
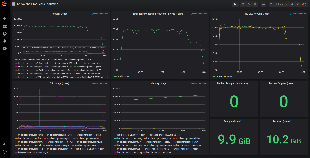
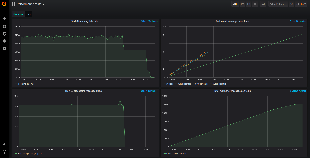
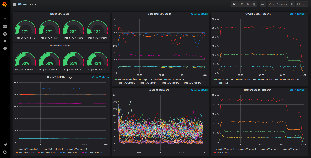
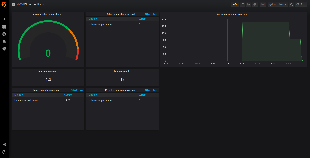
Below tables show the test results across a wide range of containers' number. 

NUMBER OF PRODUCERSTOTAL MESSAGES PROCESSEDDIFFERENCE BETWEEN ALL MESSAGES AND SENT TO HV-VESAVERAGE PROCESSING TIME IN HV-VES WITHOUT ROUTING [ms]AVERAGE LATENCY TO HV-VES OUTPUT WITH ROUTING [ms]PEAK INCOMING DATA RATE [MB/s]PEAK PROCESSING MESSAGE QUEUE SIZEPEAK CPU LOAD [%]PEAK MEMORY USAGE [GB]RESULTS PRESENTED IN GRAFANA
218000000.0251.71.633.40.37

436000000.0212.13.2144.90.37

654000000.022.54.8606.20.38

872000000.022.96.4247.40.37

1090000000.0185.58.02018.10.36

Image RemovedImage RemovedImage RemovedImage RemovedImage RemovedImage RemovedImage AddedImage AddedImage AddedImage AddedImage AddedImage Added


121080000000.019141.79.717169.10.44

Image RemovedImage RemovedImage RemovedImage RemovedImage RemovedImage RemovedImage AddedImage AddedImage AddedImage AddedImage AddedImage Added

1412600000031756816.057788.60.50Image RemovedImage RemovedImage RemovedImage RemovedImage RemovedImage Removed

Image AddedImage AddedImage AddedImage AddedImage AddedImage Added


Image Added