What is Culprit Locator
Culprit Locator (or root-cause finder) is a set of ELK-based dashboards created based on ONAP logs to identify where within a failed flow that a problem originated in the most efficient and effective way. The intention is that this would be able to help the testers and developers to get issues from identification to diagnosis/fix more quickly. This application demonstrates how the traceable logs can be used to enhance troubleshooting efforts for the testers and developers. The current version is based on explicit ERROR logs to quickly locate the problem sources in terms of components or subcomponents or a series of significant log details.
Features
- Given a RequestId (or TransactionId), bring all related logs across all components for investigation
- Aggregate and visualize the logs by log level as highlighting the meaningful logs with a color coding
- List up all significant logs and their details
- Provide a drilldown link for further investigation at the subcomponent level
Data Requirements (logstash)
We assume the index pattern "logstash-*" has been created on Kibana either by default or manual (refer to Logging User Guide Dashboard), and the following data fields are available from the latest version of onap-pipeline.conf:
- Timestamp (date formatted)
- RequestId (UUID)
- componentName (string)
- subComponent (string)
- loglevel (one of INFO, DEBUG, WARN, ERROR)
- detailmessage (which is equivalent to message but aggregatable)
- source (log file path)
- Logger (logging object)
Kibana Scripted Fields
The following two fields need to be manually created by the user on Kibana scripted field page:
- LogLevel: which is equivalent to "loglevel" with color coding

- Drill Down: URL link to the subcomponent level dashboard (see below for the details)

Script
- The drill-down time range is pre-set by -60 seconds to +5 seconds; the user could change the values as necessary.
- The IP address in the URL of the code should be modified for the user's ONAP kibana server.
- The dashboard ID (105a83d0- ... in the code) should match with the one for the imported dashboard "Culprit Locator (Subcomponent Level)".
- The drill-down time range is pre-set by -60 seconds to +5 seconds; the user could change the values as necessary.
if (doc['loglevel.keyword'].value != "INFO") {

  DateTimeFormatter ft = DateTimeFormatter.ofPattern("YYYY-MM-dd HH:mm:ss.SSS");
  Instant from_instant = Instant.ofEpochMilli(doc['Timestamp'].value - 60000);
  Instant to_instant = Instant.ofEpochMilli(doc['Timestamp'].value + 5000);
  ZonedDateTime from_z = from_instant.atZone(ZoneId.of("UTC"));
  ZonedDateTime to_z = to_instant.atZone(ZoneId.of("UTC"));
  String from_ts = from_z.format(ft);
  String to_ts = to_z.format(ft);

  String ReqId = doc['RequestId.keyword'].value;
  String URL = "http://10.147.58.138:5601/app/kibana#/dashboard/105a83d0-215e-11e8-a744-95cec6f8f1a4?_g=(refreshInterval:(display:Off,pause:!f,value:0),time:(from:'" + from_ts + "',mode:absolute,to:'" + to_ts + "'))&_a=(description:'',filters:!(),options:(darkTheme:!f),query:(query_string:(analyze_wildcard:!t,query:'RequestId:%20%22" + ReqId + "%22')),timeRestore:!f,viewMode:view)";

  return URL;

}
Import Kibana Dashboards/Visualizations
To import the dashboards and visualizations, the user could either run the script on the ONAP kibana server, or import the json object from the user's computer.
Download and uncompress the tar file attached in the home directory of your onap-log kibana server. Run the script, "import_onap_kibana_objects"
or
Download json object file attached to the user's computer, and on Kibana do Management→Saved Objects → Import the object file.
How To Use
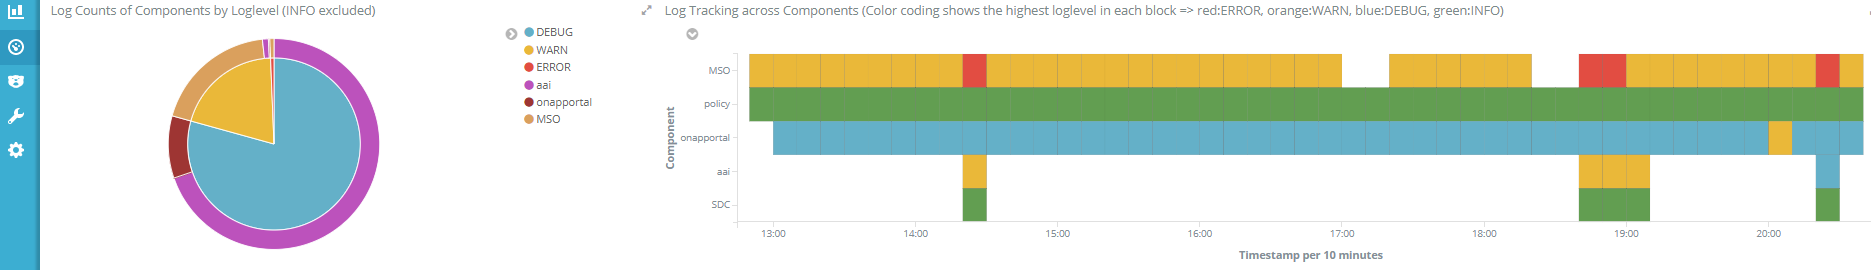
1. Open Dashboard "Culprit Locator (Component Level)" and adjust the time picker for the parts you're interested in or choose one like "Last 7 days". The dashboard features:
- Pie-in-pie chart shows the total log counts of components for each log level
- Log tracking visualization across the components over time: each box represents a collection of logs for the time slot highlighting the most severe loglevel using a color scheme (see the legend in the title of chart, e.g., a red box indicates that at least one ERROR log exists in the time slot). On this chart, you can zoom in any specific time frame by mouse dragging, or click any box to drill down the logs in there
- Table of ERROR logs and the components involved with them. Each Error record provides a link (displayed as "view") to a separate drill-down dashboard based on the timestamp of the error.
- Table of all relevant logs at all loglevel (to see that, need to scroll down the dashboard)

To investigate the logs associated with a specifc RequestId, put the RequestId in the search box like below and adjust the time period to locate the logs you want to see. (Note) RequestId should be quoted for the correct search query.

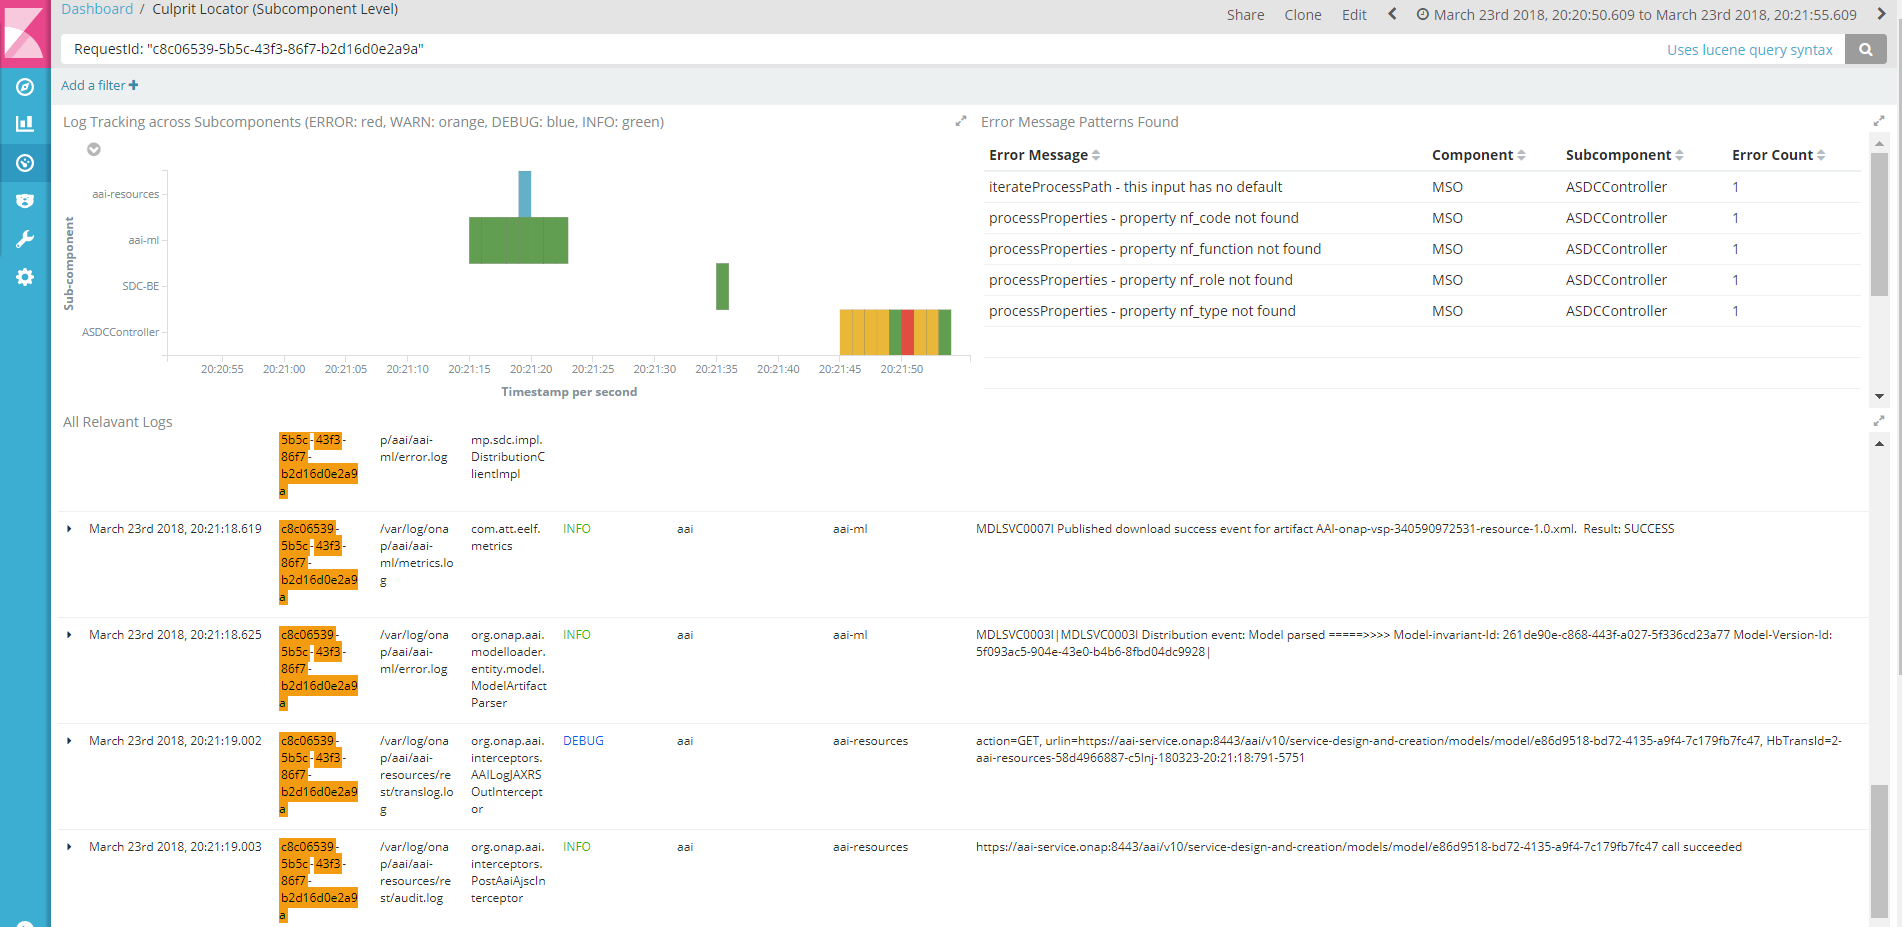
2. Drill-down (or more focused) view dashboard automatically opens as a separate tab with time perid set ranging from -60 seconds prior to the error time to +5 seconds after the error occurred. The user can still zoom in or click the boxes. The dashboard features:
- Log trracking by sub-components over time with the same color scheme with the previous dashboard
- Table of error message patterns categorizing all diffeerent error messages (to be imporved)
- Table of all relevant logs at all loglevel, scrollable for investigating the logs for the specified time period