Test architecture
In order to conduct client tests this will be conducted in following architecture:

- HV-VES Client - produces high amount of events for processing.
- Processing Consumer - consumes events from Kafka topics and creates performance metrics.
- Offset Consumer - reads Kafka offsets.
- Prometheus - sends requests for performance metrics to HV-VES, Processing Consumer and Offset Consumer, provides data to Grafana.
- Grafana - delivers analytics and its visualization.
Link between HV-VES Client and HV-VES is TLS secured (provided scripts generate and place certificates on proper containers).
Note: In the Without DMaaP Kafka tests the DMaaP/Kafka service was substituted with wurstmeister kafka
Environment and Resources
Kubernetes cluster with 4 worker nodes, sharing hardware configuration shown in a table below, is deployed in OpenStack cloud operating system. The test components in docker containers are further deployed on the Kubernetes cluster.
| Configuration | ||
|---|---|---|
CPU | Model | Intel(R) Xeon(R) CPU E5-2680 v4 |
| No. of cores | 24 | |
| CPU clock speed [GHz] | 2.40 | |
| Total RAM [GB] | 62.9 | |
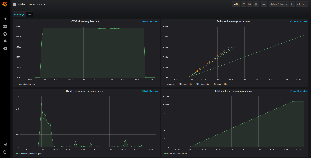
Network Performance
Pod measurement method
In order to check cluster network performance tests with usage of Iperf3 have been applied. Iperf is a tool for measurement of the maximum bandwidth on IP networks, it runs on two mode: server and client. We used a docker image: networkstatic/iperf3.
Following deployment creates a pod with iperf (server mode) on one worker, and one pod with iperf client for each worker.
To create deployment, execute following command:
kubectl create -f deployment.yaml
To find all iperf pods, execute:
kubectl -n onap get pods -o wide | grep iperf
To measure connection between pods, run iperf on iperf-client pod, using following command:
kubectl -n onap exec -it <iperf-client-pod> -- iperf3 -c iperf3-server
To change output format from MBits/sec to MBytes/sec:
kubectl -n onap exec -it <iperf-client-pod> -- iperf3 -c iperf3-server -f MBytes
To change measure time:
kubectl -n onap exec -it <iperf-client-pod> -- iperf3 -c iperf3-server -t <time-in-second>
To gather results, the command was executed:
kubectl -n onap exec -it <iperf-client-pod> -- iperf3 -c iperf3-server -f MBytes
Results of performed tests
worker1 (136 MBytes/sec)
worker2 (87 MBytes/sec)
worker3 (135 MBytes/sec)
worker0 (2282 MBytes/sec) (iperf client and server exist on same worker )
Average speed (without worker 0 ) : 119 MBytes/sec
Test Setup
Preconditions
- Installed ONAP (Frankfurt)
- Plain TCP connection between HV-VES and clients (default configuration)
- Metric port exposed on HV-VES service
In order to reach metrics endpoint in HV-VES there is a need to add the following lines in the ports section of HV-VES service configuration file:
  - name: port-t-6060
	port: 6060
	protocol: TCP
	targetPort: 6060
Before start tests, download docker image of producer which is available here:

To extract image locally use command:
docker load < hv-collector-go-client.tar.gz
Modify tools/performance/cloud/producer-pod.yaml file to use the above image and set imagePullPolicy to IfNotPresent:
...
spec:
  containers:
    - name: hv-collector-producer
      image: onap/org.onap.dcaegen2.collectors.hv-ves.hv-collector-go-client:latest
      imagePullPolicy: IfNotPresent
      volumeMounts:
...
To execute performance tests we have to run functions from a shell script cloud-based-performance-test.sh in HV-VES project directory: ~/tools/performance/cloud/
First we have to generate certificates in ~/tools/ssl folder by using gen_certs. This step only needs to be performed during the first test setup (or if the generated files have been deleted).
Generating certificates./cloud-based-performance-test.sh gen_certs
Then we call setup in order to send certificates to HV-VES, and deploy Consumers, Prometheus, Grafana and create their ConfigMaps.
Setting up the test environment./cloud-based-performance-test.sh setup
After completing previous steps we can call the start function, which provides Producers and starts the test.
Performing the test./cloud-based-performance-test.sh start
For the start function we can use optional arguments:
--load should the test keep defined number of running producers until script interruption (false) --containers number of producer containers to create (1) --properties-file path to file with benchmark properties (./test.properties) --retention-time-minutes retention time of messages in kafka in minutes (60) Example invocations of test start:
Starting performance test with single producers creation./cloud-based-performance-test.sh start --containers 10
The command above starts the test that creates 10 producers which send the amount of messages defined in test.properties once.
Starting performance test with constant messages load./cloud-based-performance-test.sh start --load true --containers 10 --retention-time-minutes 30
This invocation starts load test, meaning the script will try to keep the amount of running containers at 10 with kafka message retention of 30 minutes.
The test.properties file contains Producers and Consumers configurations and it allows setting following properties:
Producer hvVesAddress HV-VES address (dcae-hv-ves-collector.onap:6061) client.count Number of clients per pod (1) message.size Size of a single message in bytes (16384) message.count Amount of messages to be send by each client (1000) message.interval Interval between messages in miliseconds (1) Certificates paths client.cert.path Path to cert file (/ssl/client.p12) client.cert.pass.path Path to cert's pass file (/ssl/client.pass) Consumer kafka.bootstrapServers Adress of Kafka service to consume from (message-router-kafka:9092) kafka.topics Kafka topics to subscribe to (HV_VES_PERF3GPP)
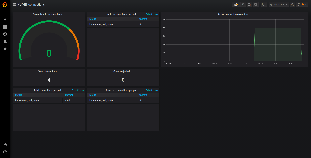
Results can be accessed under following links:
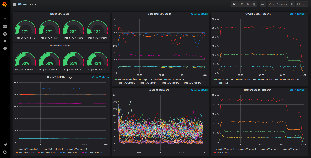
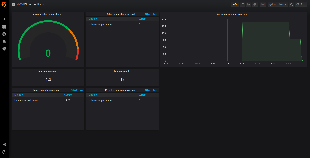
HV-VES Performance test results
With dmaap Kafka
Conditions
Tests were performed with 5 repetitions for each configuration shown in the table below.
| Number of producers | Messages per producer | Payload size [B] | Interval [ms] |
|---|---|---|---|
| 2 | 90000 | 8192 | 10 |
| 4 | 90000 | 8192 | 10 |
| 6 | 60000 | 8192 | 10 |
Raw results data
Raw results data with screenshots can be found in following files:
- Series 1 - results_series_1_with_dmaap.zip
- Series 2 - results_series_2_with_dmaap.zip
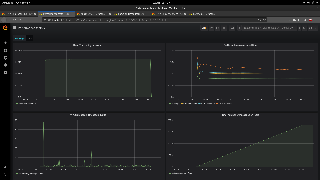
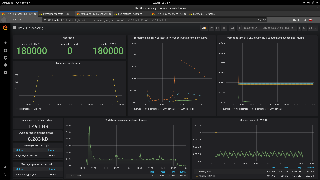
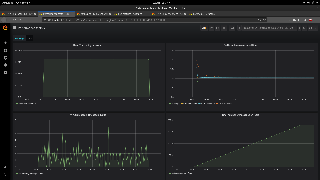
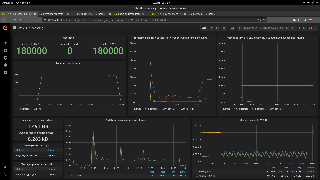
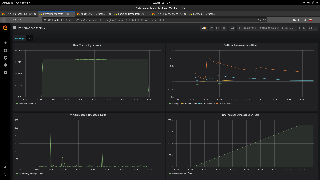
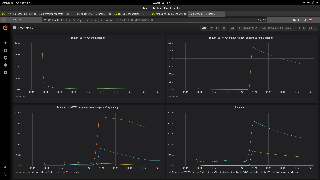
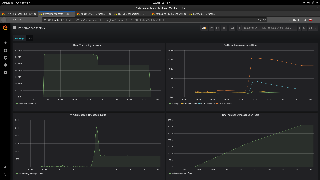
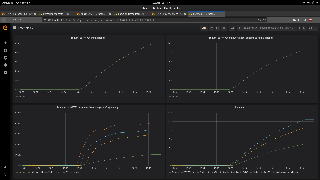
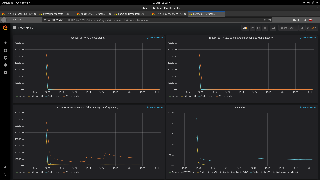
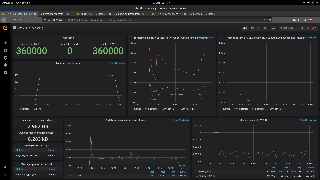
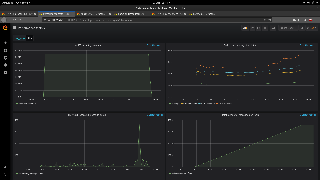
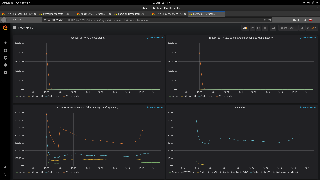
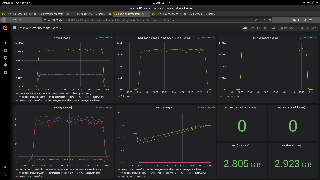
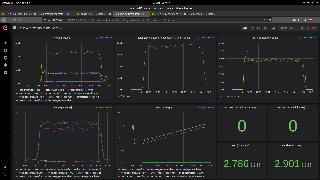
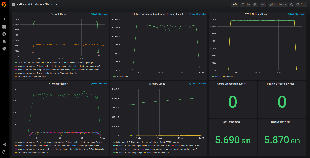
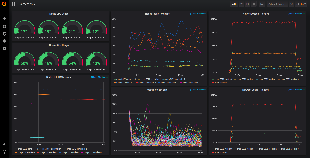
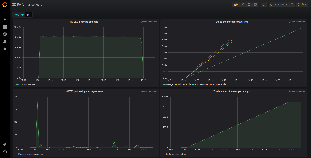
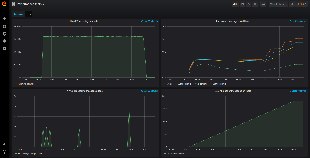
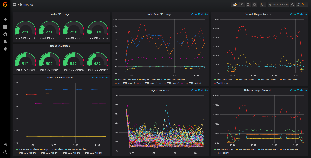
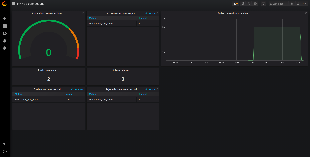
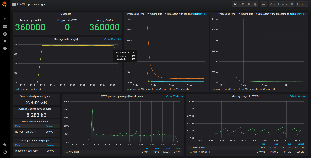
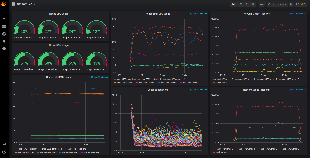
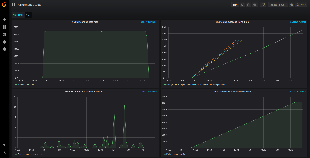
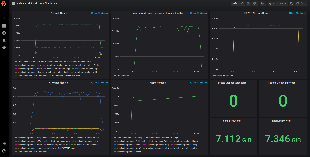
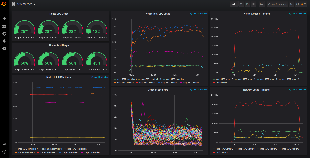
Test Results - series 1
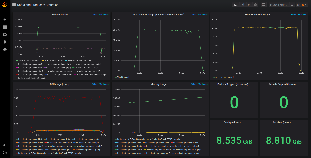
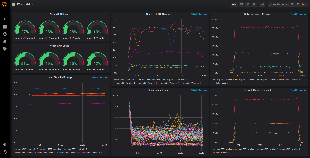
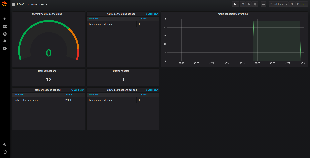
Below tables show the test results across a wide range of containers' number.
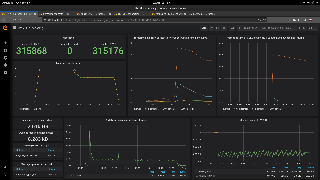
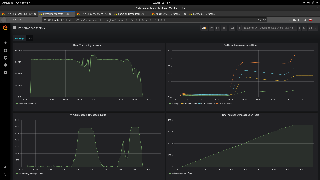
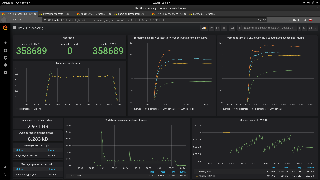
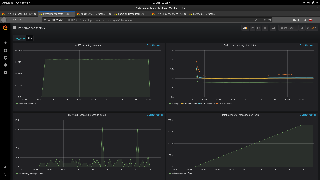
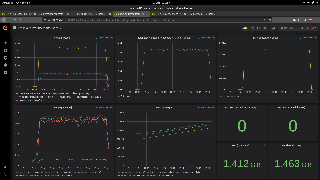
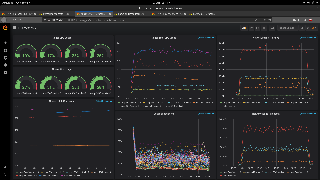
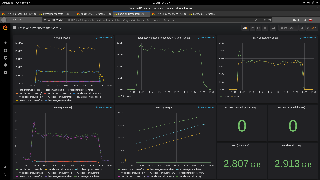
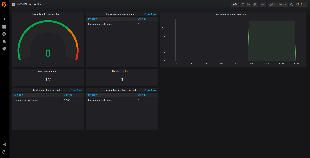
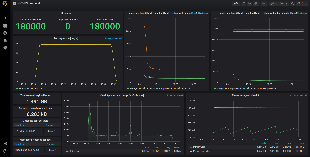
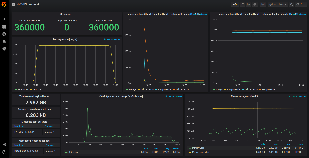
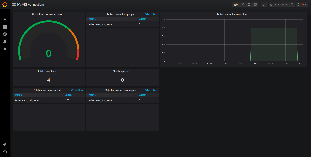
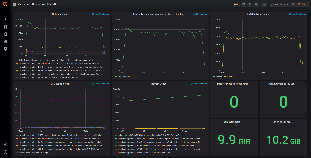
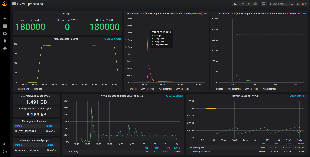
| NUMBER OF PRODUCERS | TOTAL MESSAGES PROCESSED | DIFFERENCE BETWEEN ALL MESSAGES AND SENT TO HV-VES | AVERAGE PROCESSING TIME IN HV-VES WITHOUT ROUTING [ms] | AVERAGE LATENCY TO HV-VES OUTPUT WITH ROUTING [ms] | PEAK INCOMING DATA RATE [MB/s] | PEAK PROCESSING MESSAGE QUEUE SIZE | PEAK CPU LOAD [%] | PEAK MEMORY USAGE [GB] | RESULTS PRESENTED IN GRAFANA |
|---|---|---|---|---|---|---|---|---|---|
| 2 | 180000 | 0 | 0.03 | 54 | 1.6 | 175 | 2.9 | 0.38 |
|
| 2 | 180000 | 0 | 0.021 | 8.5 | 1.6 | 6 | 3.2 | 0.37 |
|
| 2 | 180000 | 0 | 0.022 | 14.8 | 1.6 | 66 | 2.4 | 0.38 |
|
| 2 | 180000 | 0 | 0.023 | 19.4 | 1.6 | 59 | 2.2 | 0.38 |
|
| 2 | 180000 | 0 | 0.021 | 7.6 | 1.6 | 58 | 2.6 | 0.36 |
 |


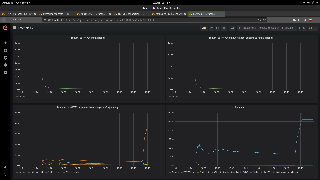
| NUMBER OF PRODUCERS | TOTAL MESSAGES PROCESSED | DIFFERENCE BETWEEN ALL MESSAGES AND SENT TO HV-VES | AVERAGE PROCESSING TIME IN HV-VES WITHOUT ROUTING [ms] | AVERAGE LATENCY TO HV-VES OUTPUT WITH ROUTING [ms] | PEAK INCOMING DATA RATE [MB/s] | PEAK PROCESSING MESSAGE QUEUE SIZE | PEAK CPU LOAD [%] | PEAK MEMORY USAGE [GB] | RESULTS PRESENTED IN GRAFANA |
|---|---|---|---|---|---|---|---|---|---|
| 4 | 315868 | 44824 | 82 | 260 | 3,2 | 2400 | 3 | 0,4 |
  |
| 4 | 359193 | 807 | 3660 | 10408 | 3,2 | 3100 | 4,9 | 0,78 |
|
| 4 | 359401 | 591 | 1350 | 3486 | 3.7 | 3000 | 4,9 | 0,56 |
|
| 4 | 360000 | 0 | 1.5 | 130 | 3.3 | 1200 | 4.1 | 0.39 |
 |
| 4 | 360000 | 0 | 0.02 | 57 | 3.3 | 180 | 3.5 | 0.38 |
|


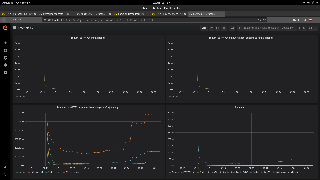
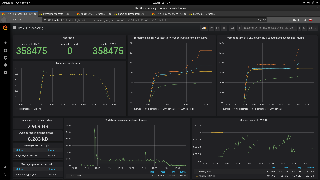
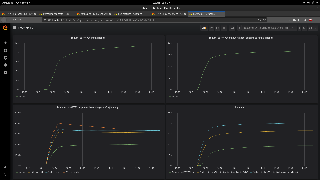
| NUMBER OF PRODUCERS | TOTAL MESSAGES PROCESSED | DIFFERENCE BETWEEN ALL MESSAGES AND SENT TO HV-VES | AVERAGE PROCESSING TIME IN HV-VES WITHOUT ROUTING [ms] | AVERAGE LATENCY TO HV-VES OUTPUT WITH ROUTING [ms] | PEAK INCOMING DATA RATE [MB/s] | PEAK PROCESSING MESSAGE QUEUE SIZE | PEAK CPU LOAD [%] | PEAK MEMORY USAGE [GB] | RESULTS PRESENTED IN GRAFANA |
|---|---|---|---|---|---|---|---|---|---|
| 6 | 358475 | 1525 | 6600 | 17875 | 4.9 | 4900 | 5.8 | 0.97 |
|
| 6 | 358494 | 1506 | 7080 | 20182 | 4.7 | 4500 | 4.5 | 0.97 |
|
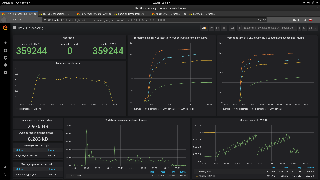
| 6 | 359244 | 756 | 4900 | 17231 | 4.9 | 1900 | 3.9 | 0.93 |
|
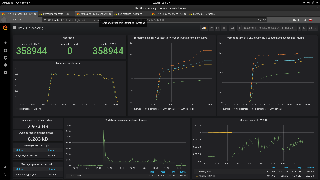
| 6 | 358944 | 1056 | 6150 | 17200 | 4.9 | 4800 | 5 | 0.97 |
|
| 6 | 358689 | 1311 | 5410 | 17202 | 4.9 | 4100 | 5 | 0.96 |
|


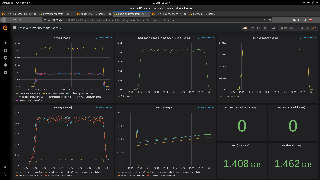
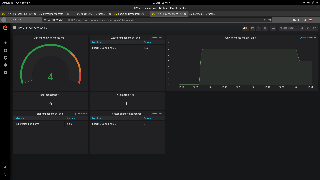
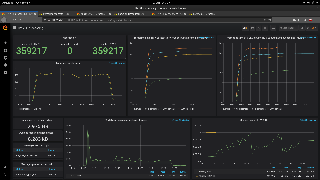
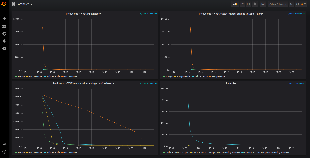
Test Results - series 2
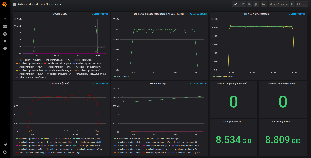
| NUMBER OF PRODUCERS | TOTAL MESSAGES PROCESSED | DIFFERENCE BETWEEN ALL MESSAGES AND SENT TO HV-VES | AVERAGE PROCESSING TIME IN HV-VES WITHOUT ROUTING [ms] | AVERAGE LATENCY TO HV-VES OUTPUT WITH ROUTING [ms] | PEAK INCOMING DATA RATE [MB/s] | PEAK PROCESSING MESSAGE QUEUE SIZE | PEAK CPU LOAD [%] | PEAK MEMORY USAGE [GB] | RESULTS PRESENTED IN GRAFANA |
|---|---|---|---|---|---|---|---|---|---|
| 2 | 180000 | 0 | 0.026 | 8.9 | 1.6 | 11 | 3 | 0.35 |
|
| 2 | 180000 | 0 | 0.026 | 11.3 | 1.6 | 23 | 3.2 | 0.35 | 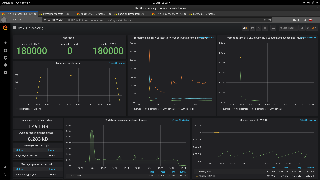
|


| NUMBER OF PRODUCERS | TOTAL MESSAGES PROCESSED | DIFFERENCE BETWEEN ALL MESSAGES AND SENT TO HV-VES | AVERAGE PROCESSING TIME IN HV-VES WITHOUT ROUTING [s] | AVERAGE LATENCY TO HV-VES OUTPUT WITH ROUTING [ms] | PEAK INCOMING DATA RATE [MB/s] | PEAK PROCESSING MESSAGE QUEUE SIZE | PEAK CPU LOAD [%] | PEAK MEMORY USAGE [GB] | RESULTS PRESENTED IN GRAFANA |
|---|---|---|---|---|---|---|---|---|---|
| 4 | 360000 | 0 | 0.022 | 41.3 | 3.2 | 130 | 4 | 0.35 |   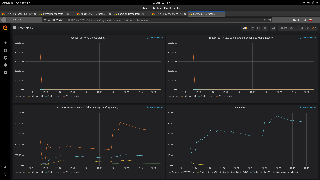
|
| 4 | 360000 | 0 | 0.023 | 40.7 | 3.2 | 370 | 4.2 | 0.35 |
|


| NUMBER OF PRODUCERS | TOTAL MESSAGES PROCESSED | DIFFERENCE BETWEEN ALL MESSAGES AND SENT TO HV-VES | AVERAGE PROCESSING TIME IN HV-VES WITHOUT ROUTING [ms] | AVERAGE LATENCY TO HV-VES OUTPUT WITH ROUTING [ms] | PEAK INCOMING DATA RATE [MB/s] | PEAK PROCESSING MESSAGE QUEUE SIZE | PEAK CPU LOAD [%] | PEAK MEMORY USAGE [GB] | RESULTS PRESENTED IN GRAFANA |
|---|---|---|---|---|---|---|---|---|---|
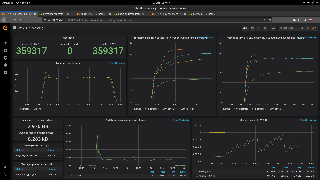
| 6 | 359317 | 683 | 6240 | 15965 | 4.8 | 4500 | 4.3 | 1 |
|
| 6 | 359217 | 783 | 6490 | 16834 | 4.8 | 4200 | 5.8 | 1 |
|


No DMaaP Kafka SetUp
Install Kafka Docker on Kubernetes
(based on: ultimate-guide-to-installing-kafka-docker-on-kuber)
Create config maps
Config maps are required by zookeeper and kafka-broker deployments.
kubectl -n onap create cm kafka-config-map --from-file=kafka_server_jaas.conf
kubectl -n onap create cm zk-config-map --from-file=zk_server_jaas.conf
Create deployments
kubectl -n onap create -f zookeeper.yml
kubectl -n onap create -f kafka-service.yml
kubectl -n onap create -f kafka-broker.yml
Verify that pods are up and running
kubectl -n onap get pods | grep 'zookeeper-deployment-1\|broker0'
kubectl -n onap get svc | grep kafka-service
If you need to change some variable or anything in a yml file, delete the current deployment, for example:
kubectl -n onap delete deploy kafka-broker0
And after modifying the file create a new deployment as described above.
Run the test
Modify tools/performance/cloud scripts to match the names in your deployments, described in the previous step. Here is a diff file (you may need to adapt it to the current code situation):
Go to tools/performance/cloud and reboot the environment:
./reboot-test-environment.sh -v
Now you are ready to run the test.
Without DMaaP Kafka
Conditions
Tests were performed with following configuration:
| Messages per producer | Payload size [B] | Interval [ms] |
|---|---|---|
| 90000 | 8192 | 10 |
Raw results data
Raw results data with screenshots can be found in following files:
- Series 1 - results_series_1.zip
- Series 2 - results_series_2.zip
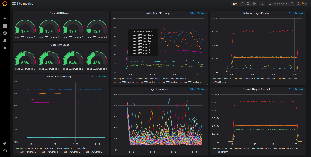
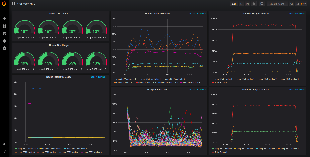
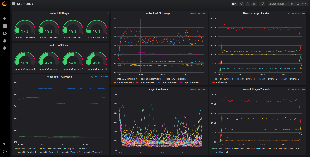
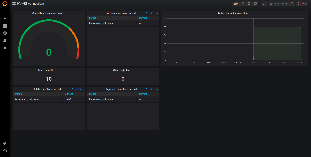
To see custom Kafka metrics you may want to change kafka-and-producers.json (located in HV-VES project directory: tools/performance/cloud/grafana/dashboards) to
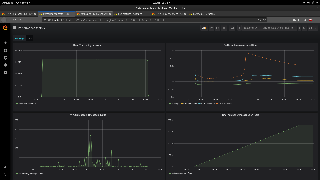
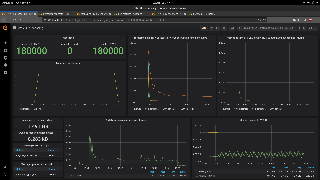
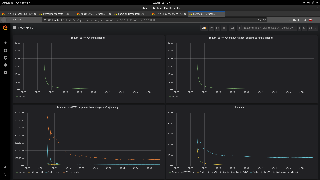
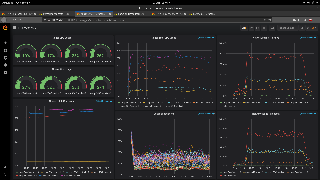
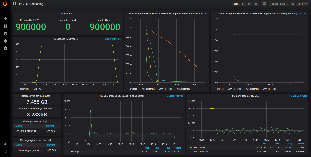
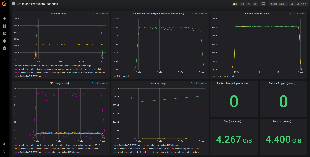
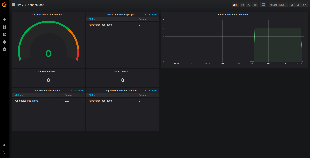
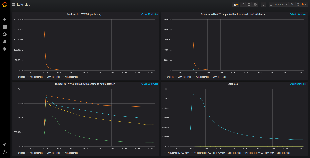
Test results - series 1
Below tables show the test results across a wide range of containers' number.
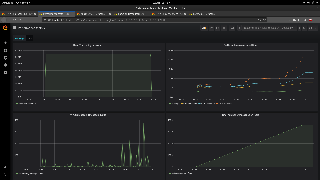
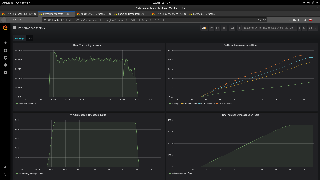
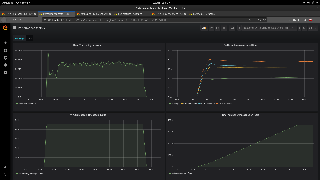
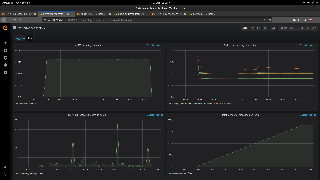
| NUMBER OF PRODUCERS | TOTAL MESSAGES PROCESSED | DIFFERENCE BETWEEN ALL MESSAGES AND SENT TO HV-VES | AVERAGE PROCESSING TIME IN HV-VES WITHOUT ROUTING [ms] | AVERAGE LATENCY TO HV-VES OUTPUT WITH ROUTING [ms] | PEAK INCOMING DATA RATE [MB/s] | PEAK PROCESSING MESSAGE QUEUE SIZE | PEAK CPU LOAD [%] | PEAK MEMORY USAGE [GB] | RESULTS PRESENTED IN GRAFANA |
|---|---|---|---|---|---|---|---|---|---|
| 2 | 180000 | 0 | 0.024 | 1.5 | 1.6 | 3 | 3.5 | 0.37 |
|
| 4 | 360000 | 0 | 0.020 | 1.7 | 3.2 | 3 | 5.7 | 0.37 |
|
| 6 | 540000 | 0 | 0.02 | 2.6 | 4.8 | 24 | 6.0 | 0.37 | 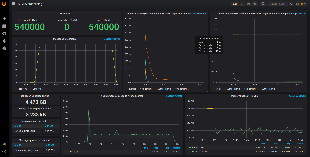 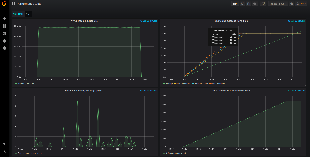
|
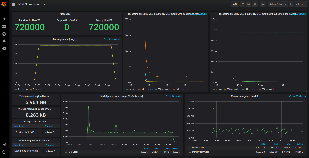
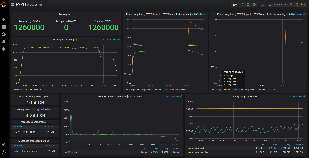
| 8 | 720000 | 0 | 0.02 | 2.8 | 6.4 | 14 | 8.5 | 0.37 |
|
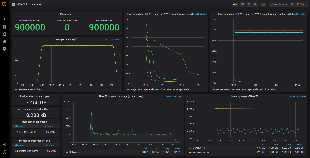
| 10 | 900000 | 0 | 0.02 | 7.3 | 8.1 | 552 | 8.5 | 0.38 |
|
| 12 | 10800000 | 0 | 0.02 | 78 | 9.7 | 1077 | 7.5 | 0.41 |
   |
| 14 | 12600000 | 0 | 6140 | 19000 | 13.0 | 10630 | 9.8 | 0.99 |
|


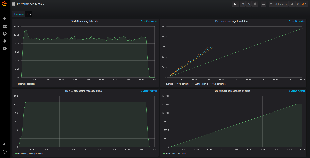

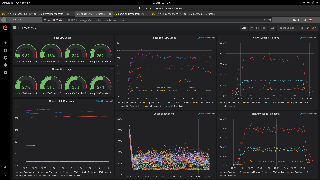
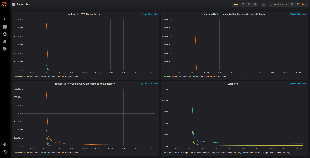
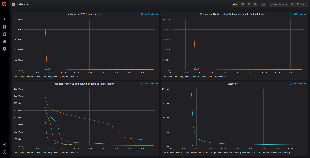
Test results - series 2
Below tables show the test results across a wide range of containers' number.
| NUMBER OF PRODUCERS | TOTAL MESSAGES PROCESSED | DIFFERENCE BETWEEN ALL MESSAGES AND SENT TO HV-VES | AVERAGE PROCESSING TIME IN HV-VES WITHOUT ROUTING [ms] | AVERAGE LATENCY TO HV-VES OUTPUT WITH ROUTING [ms] | PEAK INCOMING DATA RATE [MB/s] | PEAK PROCESSING MESSAGE QUEUE SIZE | PEAK CPU LOAD [%] | PEAK MEMORY USAGE [GB] | RESULTS PRESENTED IN GRAFANA |
|---|---|---|---|---|---|---|---|---|---|
| 2 | 180000 | 0 | 0.025 | 1.7 | 1.6 | 3 | 3.4 | 0.37 |
|
| 4 | 360000 | 0 | 0.021 | 2.1 | 3.2 | 14 | 4.9 | 0.37 |
|
| 6 | 540000 | 0 | 0.02 | 2.5 | 4.8 | 60 | 6.2 | 0.38 |
|
| 8 | 720000 | 0 | 0.02 | 2.9 | 6.4 | 24 | 7.4 | 0.37 |
|
| 10 | 900000 | 0 | 0.018 | 5.5 | 8.0 | 201 | 8.1 | 0.36 |
|
| 12 | 10800000 | 0 | 0.019 | 141.7 | 9.7 | 1716 | 9.1 | 0.44 |
|
| 14 | 12600000 | 0 | 31 | 7568 | 16.0 | 5778 | 8.6 | 0.50 |
|


6 Comments
Vijay Venkatesh Kumar
Kornel Janiak - Pls use this wiki for recording HV-VES performance test steps/result
Tarun AGRAWAL
The Test Architecture diagram does not load on this page. Request if it can be fixed. thx.
Joanna Jeremicz
It will be fixed. Thank you for pointing it out.
Prativa Dora
I am unable to download docker image of producer. Below link is not accessible.
https://confluence.ext.net.nokia.com/download/attachments/983925650/hv-collector-go-client.tar.gz?version=1&modificationDate=1588920767000&api=v2
Can someone help me out . Thanks.
Kornel Janiak
Hi I have uploaded image, it should be ok. BR,
Prativa Dora
Thanks Kornel. Now I can access it.