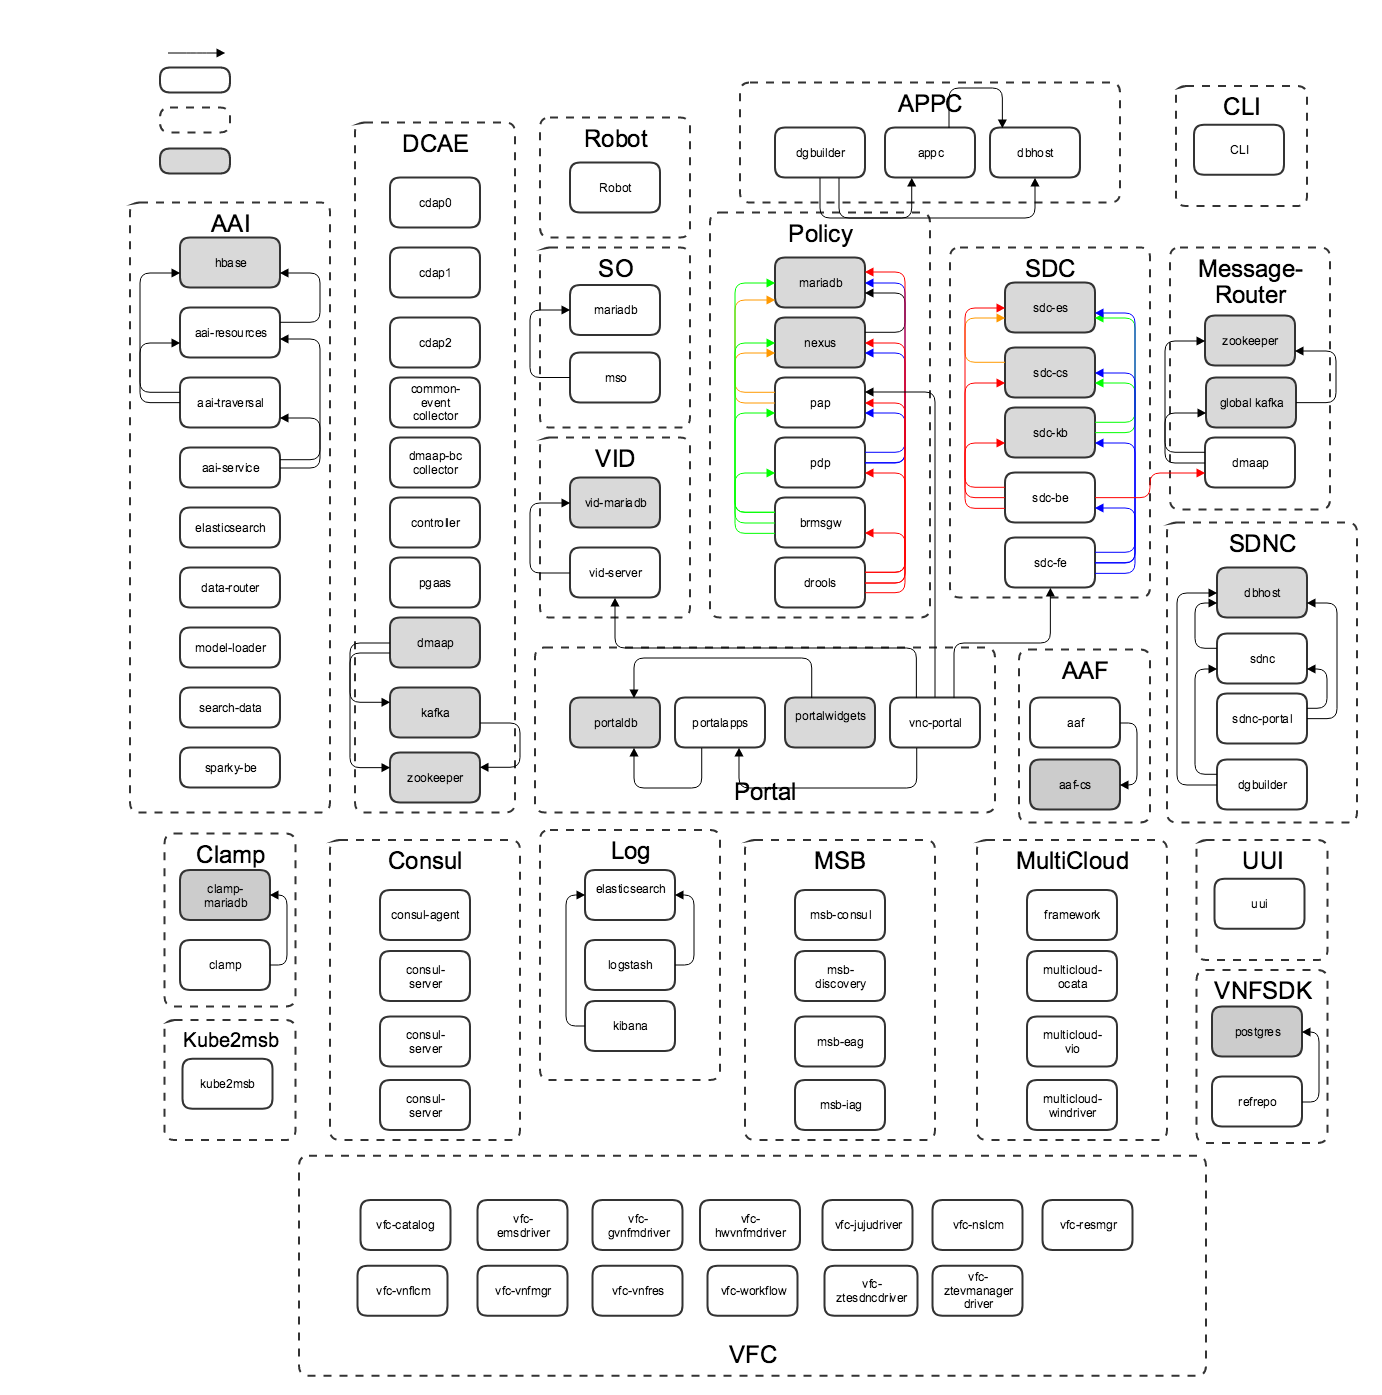
Casablanca Deployment Diagram
in progress

Warning: Draft Content
This wiki is under construction
This page details the current deployment artifacts (VM's, docker containers, ports, WARs ...) based on reverse-engineering a deployed demo as well as the current code base. These are useful as a snapshot of what is actually running in support of our ONAP architecture - to aide in running/triaging the Demo as it evolves.
OOM Pod Init Dependencies
Version 1.0.0
 I
I
n progress
The above 1.0.0 ONAP deployment diagram is based on the following rackspace environment
artifacts_version: 1.0.0-SNAPSHOT docker_version: 1.0-STAGING-latest gerrit_branch: release-1.0.0 gitlab_branch: master dcae_code_version: 1.0.0 |
|---|
Notes
Links
I keep forgetting about this page - because its content is hidden by default - Release Notes 1.0.0 draft#VMsandContainers
List of docker images - https://gerrit.onap.org/r/gitweb?p=integration.git;a=blob;f=packaging/docker/docker-images.csv;h=9bac826b024ed76fb991ea3694ca39a669f53bbe;hb=refs/heads/master
9 Comments
Josef Reisinger
Great Drawing!
A minor observation: All images are named as Ubuntu 14.04, aren't MSO, Robot and SDC Ubuntu 16.04?
Marco Platania
Yes, Robot, MSO and SDC use Ubuntu 16.04
Michael O'Brien
Yes, it is a WIP - likely for the next 48 hours - got it up for a discussion but still editing it/transferring from my notebook.
IE: there are 13 14.0.4 and 4 16.04 VM's (including DCAE zldciad4vipstg00) - also there are 17 VM's (12+ 5 DCAE (non-heat template)) - not including 2-3 after the demo is run. Several of the docker containers don't have their wars yet - should be clean by Sat.
/michael
Manoj Nair
Is there any significance of the colors used ? for e.g. yellow rectangular dot on each component signifies something?. What is the meaning of Groovy box in DCAE with couple of non-docker green boxes ? Are they processes or VMs ?
Michael O'Brien
I asked that same question about colors about 16 years ago in a meeting - "they look good" - we all laughed. Here, they hopefully are used for partitioning by type.
light blue = jar processes, dark blue = war containers, darkest blue = Maria, yellow = deployed artifacts, orange = zookeeper, green = non-docker processes
dotted line containers = VM's, solid line boxes are processes (docker/non-docker)
The template is mostly from AWS - the orange dot containers are VMs via the heat template, the grey containers are VMs outside of the heat template (the 5 dcae ones).
The groovy section corresponds to construction of the dynamic DCAE VM - still finalizing understanding of how orchestration is done here in DCAE for 1.0.0
Eric Debeau
The diagram is very clear to understand the various components.
Some corrections:
Some proposals to improve the diagram:
I can help to update it, but we should introduce this diagram in the Documentation or OOM repo to facilitate the collaborative work.
Michael O'Brien
Eric, Will update all. I was starting a 1.1 version as an embeddable gliffy (editable in the page) - but 1.1.0 is currently failing pulling from nexus. What I will do is redo it as 1.0 and put in the 1.1 changes around aai/policy...
I verified most of these by directly going on each box and validating the docker containers - I might have had a diagram copy/paste - fixed
For dependency calls - I follow the diagram by Gildas - but we need to differentiate between actual running state (1.1.x and proposed R1 state)
Internal links are the next step - time permitting - will be easier when the diagram is editable shortly.
2nd time around we are looking OK for 1.1.0-SNAPSHOT/master - moving on to 1.1 diagram
Processing triggers for ureadahead (0.100.0-19) ...
% Total % Received % Xferd Average Speed Time Time Time Current
Dload Upload Total Spent Left Speed
100 617 0 617 0 0 2919 0 --:--:-- --:--:-- --:--:-- 2924
100 7857k 100 7857k 0 0 16.9M 0 --:--:-- --:--:-- --:--:-- 16.9M
Cloning into 'test_lab'...
Already up-to-date.
docker command: local docker using unix socket
tName": "AUTO" } }, "mso-po-adapter-config": { "cloud_sites": [ { "id": "Dallas", "aic_version": "2.5", "lcp_clli": "DFW", "region_id": "DFW", "identity_service_id": "RAX_KEYSTONE" }, { "id": "Northern Virg
root@vm1-mso:~# docker ps
CONTAINER ID IMAGE COMMAND CREATED STATUS PORTS NAMES
06cf1d40c875 openecomp/mso "/opt/mso/scripts/..." 4 minutes ago Up 4 minutes 0.0.0.0:3904-3905->3904-3905/tcp, 0.0.0.0:8080->8080/tcp, 0.0.0.0:9990->9990/tcp testlab_mso_1
685df48e1e66 mariadb:10.1.11 "/docker-entrypoin..." 4 minutes ago Up 4 minutes 0.0.0.0:32768->3306/tcp testlab_mariadb_1
/michael
ramki krishnan
Very nice and explanatory pictures Michael. Is this the finalized deployment topology for R1? Or, are there any changes anticipated?
Thanks,
Ramki
Michael O'Brien
Good question, there are currently 3 topologies (released, current, proposed)
released: 1.0.0 (the old April release - the screencap)
current: 1.1.0/master (the actual topology - the editable diagram - since master started working again on the 12th we can populate this diagram - any changes to this diagram should come directly from a running system - this is why it is taking a while. Several of us use these diagrams to diagnose whether a deployment is valid or not) - and for validating a kubernetes deployment.
proposed: The 3rd diagram (not here yet) would be the conceptual target deployment of R1 (Currently the CLI, Logging and Policy projects are adding containers so these would go there until they actually appear in a rackspace/openstack deployment)
You are welcome to edit the current diagram - only if you are reverse engineering a "verified" fully deployed build - I am currently validating 20170812 on Rackspace - which looks stable so far for AAI, Portal, SDC, VID.
The purpose of these diagrams is define what is a "running" system - for validation and triage-throughput - a full R1/R2 architecture is in the architecture section.
/michael