Draft
This is the initial draft of the design page.
Much of the information here has been pulled from this source document: Promethus-aggregation.pdf
Requirements
- Collect hardware, infrastructure (Linux OS), Hypervisor and Kubelet statistics
- Aggregate (&Silencing) them for consumption
- Via rules
- Provide visualization of statistics
- At site granularity level
- At compute node granularity level.
- Historical level
- By Applying user defined filters
- Counter collection & aggregation service – Offload collection and aggregation at various levels.
- At ONAP level
- At Regional Site level
- At Edge Site level
- Placement decisions based on HPA resource health/availability.
Architectural Components
The following diagram illustrates the key components.
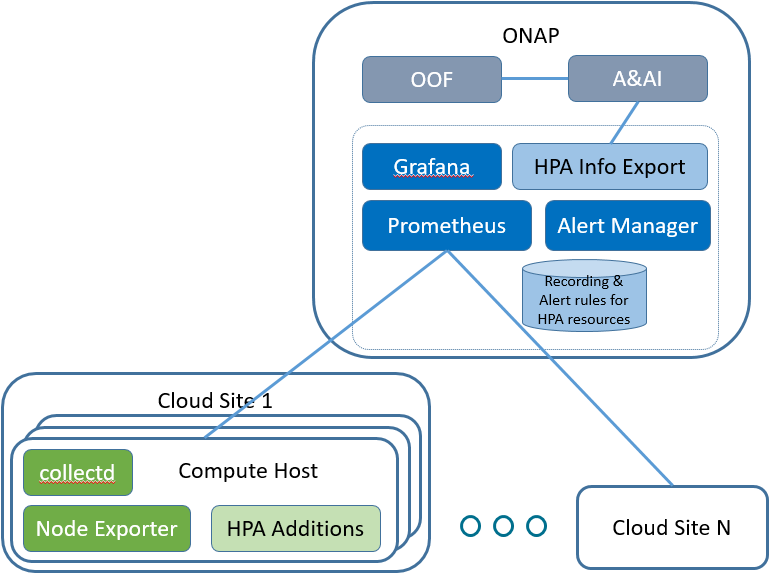
ONAP Components
Prometheus
The Prometheus server is configured to collect time series data from targets. In this case, the source of data will be the compute hosts in the cloud regions.
Alert Manager
The Alert Manager receives alerts based on alerting rules configured for the Prometheus server. Alerts can be forwarded on to clients.
HPA Info Export
For HPA telemetry capture use case, the idea is to create a client to receive alerts from the Alert Manager and update HPA information in A&AI. See HPA - Telemetry OOF and A&AI
Grafana
Configured to recieve and display information on HPA telemetry.