...
- Proposed name for projects: Logging and Analytics
- Proposed name for the repository: logging-analytics
Project Description
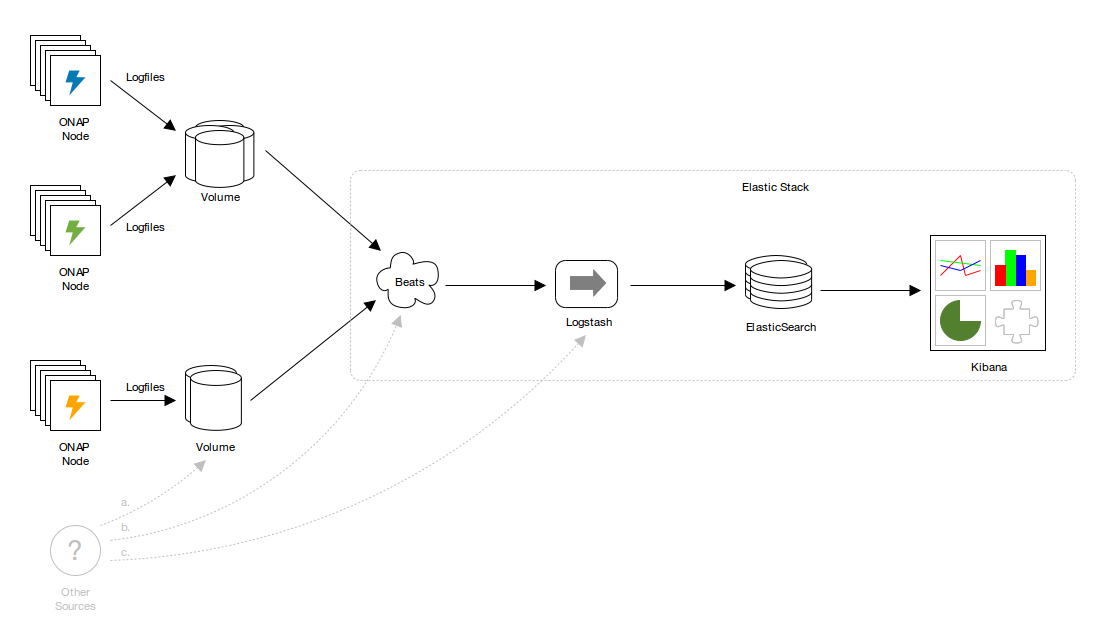
ONAP consists of many components and containers, and consequently writes to many logfiles. The volume of logger output may be enormous, especially when debugging. Large, disparate logfiles are difficult to monitor and analyze, and tracing requests across many files, file systems and containers is untenable without tooling.
The problem of decentralized logger output is addressed by analytics pipelines such as Elastic Stack (ELK). Elastic Stack consumes logs, indexes their contents in Elasticsearch, and makes them accessible, queryable and navigable via a sophisticated UI, Kibana Discover. This elevates the importance of standardization and machine-readability. Logfiles can remain browsable, but output can be simplified.
Why a Logging Project
Keywords:
Centralized, Role based access, tracking, streaming, reporting
Feature / Requirement | Description |
|---|---|
| F1 | Centralized Logs - all the logs available streamed in one place - search, visualize and report ready |
| F2 | Role based access - logs are accessible from outside the container - no ssh into the pod or tailing of the logs per microservice |
| F3 | Tracking - If a unique ID is passed across microservices we can trace a transaction pass/failure through the system requestID, InvocationID, Timestamp indexed |
| F4 | Reporting - track multiple transaction patterns and generate emergent or correlated behavior |
| F5 | Control over log content - collect, index, filter |
| F6 | Machine readable json oriented elasticsearch storage of logs |
| R1 | Logs are in the same (currently 29 field) format |
| R2 | Logging library requires minimal changes for use - using Spring AOP to get MARKER entry/exit logs for free without code changes |
| R3 | Logs are streamed to a central ELK stack |
| R4 | ELK stack provides for tracing, dashboards, query API |
Project Description
ONAP consists of many components and containers, and consequently writes to many logfiles. The volume of logger output may be enormous, especially when debugging. Large, disparate logfiles are difficult to monitor and analyze, and tracing requests across many files, file systems and containers is untenable without tooling.
The problem of decentralized logger output is addressed by analytics pipelines such as Elastic Stack (ELK). Elastic Stack consumes logs, indexes their contents in Elasticsearch, and makes them accessible, queryable and navigable via a sophisticated UI, Kibana Discover. This elevates the importance of standardization and machine-readability. Logfiles can remain browsable, but output can be simplified.
Logger configurations in Logger configurations in ONAP are diverse and idiosyncratic. Addressing these issues will prevent costs from being externalized to consumers such as analytics. It also affords the opportunity to remedy any issues with the handling and propagation of contextual information such as transaction identifiers (presently passed as X-ECOMP-RequestID - to beX-ONAP-RequestID). This propagation is critical to tracing requests as they traverse ONAP and related systems, and is the basis for many analytics functions.
...
- ONAP-wide changes to regularize logger providers, logger configuration and logger output. The changes are largely cosmetic, but greater coherence will simplify deployment orchestration and customization, and improve extensibility and support for analytics.
- A reference analytics pipeline configuration consisting of:
- Filebeat shipping
- Logstash indexing
- Elasticsearch datastore
- Kibana Discover UI
- Prometheus Metrics capture
- Documentation:
- Configuration
- Operations
- Updates to ONAP application logging guidelines.Active Logging Specifications
- Other example configurations, including:
- JSON output.
- Non-file transports, including SYSLOG and TCP.
- Durable shipping transports, such as Logstash persistent queues, or Kafka or Redis or similar if there's interest.Kibana Dashboards.interest.
- Kibana Dashboards.
- Audit:
- Specifically Post orchestration model based audit - Logging Scope Change for POMBA seed code
Out of scope:
- No impact on EELF or its use. Some ONAP components log via EELF, and some do not. This won't change.
- No prescription of logging providers. Standardization is encouraged but not mandatory. Note that certain providers (e.g. legacy Log4j 1.X) may not support all output options.
- No changes to any ONAP component without consultation with its owners. Note that components whose provider configuration is NOT aligned may not have their logs indexed without (potentially costly) ad hoc indexing configuration.
...
All changes augment ONAP application logging guidelines on the ONAP wiki. ONAP wiki.
Commits to 2 repos
https://gerrit.onap.org/r/#/q/status:merged+project:+logging-analytics
https://gerrit.onap.org/r/#/q/status:merged+project:+oom
Default logfile locations
...
The change is to add the serialization of Markers to <pattern/> in Logback provider configuration:
| Code Block | ||||
|---|---|---|---|---|
| ||||
%replace(%replace(%marker){'\t','\\\\t'}){'\n','\\\\n'} |
- Currently: Markers not written to ONAP logs.
- Affects: future ONAP and ONAP-based components.
- Priority: MEDIUM.
- Why:
- Useful and commonplace. See https://stackoverflow.com/questions/4165558/best-practices-for-using-markers-in-slf4j-logback.
- A more appropriate way of indicating metric, audit and other event types (though that change isn't proposed here).
- There's a reasonable expectation on the part of current and potential ONAP developers that Markers be supported.
- Notes:
- This example also includes tab and newline replacement.
- See Machine-readable output.
Analytics
Support for analytics pipelines
Regularizing output locations and line format simplifies shipping and indexing of logs, and enables many options for analytics. See Default logfile locations, MDCs, Markers, Machine-readable output, and Elastic Stack reference configuration.
- Currently: varies.
- Affects: most ONAP components.
- Priority: HIGH.
- Why: that's what this whole document is about!
Machine-readable output
Shipper and indexing performance and durability depends on logs that can be parsed quickly and reliably.
The proposal is:
- The use of tab or ASCII record separator (0x1E) as a delimiter. Tab is preferred.
- Escaping all messages, exceptions, MDC values, Markers, etc. to replace the delimiter. If it's tab, \t.
- Escaping all newlines with \n. This means one line per log entry.
For example (tab- and newline-separated, MDCs, a nested exception, a marker, with newlines self-consciously added between each attribute for readability):
> in Logback provider configuration:
| Code Block | ||||
|---|---|---|---|---|
| ||||
%replace(%replace(%marker){'\t','\\\\t'}){'\n','\\\\n'} |
- Currently: Markers not written to ONAP logs.
- Affects: future ONAP and ONAP-based components.
- Priority: MEDIUM.
- Why:
- Useful and commonplace. See https://stackoverflow.com/questions/4165558/best-practices-for-using-markers-in-slf4j-logback.
- A more appropriate way of indicating metric, audit and other event types (though that change isn't proposed here).
- There's a reasonable expectation on the part of current and potential ONAP developers that Markers be supported.
- Notes:
- This example also includes tab and newline replacement.
- See Machine-readable output.
...
Analytics
Support for analytics pipelines
Regularizing output locations and line format simplifies shipping and indexing of logs, and enables many options for analytics. See Default logfile locations, MDCs, Markers, Machine-readable output, and Elastic Stack reference configuration.
- Currently: varies.
- Affects: most ONAP components.
- Priority: HIGH.
- Why: that's what this whole document is about!
Machine-readable output
Shipper and indexing performance and durability depends on logs that can be parsed quickly and reliably.
The proposal is:
- The use of tab or ASCII record separator (0x1E) as a delimiter. Tab is preferred.
- Escaping all messages, exceptions, MDC values, Markers, etc. to replace the delimiter. If it's tab, \t.
- Escaping all newlines with \n. This means one line per log entry.
For example (tab- and newline-separated, MDCs, a nested exception, a marker, with newlines self-consciously added between each attribute for readability):
| Code Block | ||||
|---|---|---|---|---|
| ||||
org.onap.example.component1.subcomponent1.LogbackTest
\t2017-06-06T16:09:03.594Z
\tERROR
\tHere's an error, that's usually bad
\tkey1=value1, key2=value2 with space, key5=value5"with"quotes, key3=value3\nwith\nnewlines, key4=value4\twith\ttabs
\tjava.lang.RuntimeException: Here's Johnny
\n\tat | ||||
| Code Block | ||||
| ||||
org.onap.example.component1.subcomponent1.LogbackTest \t2017-06-06T16:09:03.594Z \tERROR \tHere's an error, that's usually bad \tkey1=value1, key2=value2 with space, key5=value5"with"quotes, key3=value3\nwith\nnewlines, key4=value4\twith\ttabs \tjava.lang.RuntimeException: Here's Johnny \n\tat org.onap.example.component1.subcomponent1.LogbackTest.main(LogbackTest.java:24) \nWrapped by: java.lang.RuntimeException: Little pigs, little pigs, let me come in \n\tat org.onap.example.component1.subcomponent1.LogbackTest.main(LogbackTest.java:27) \tAMarker1 \tmain .main(LogbackTest.java:24) \nWrapped by: java.lang.RuntimeException: Little pigs, little pigs, let me come in \n\tat org.onap.example.component1.subcomponent1.LogbackTest.main(LogbackTest.java:27) \tAMarker1 \tmain |
- Currently:
- Newlines not escaped.
- Log entry attributes pipe-delimited.
- MDC values pipe-delimited, accessed by ordinal position.
- Delimiters not escaped in messages, MDCs and other values.
- Affects: all logger provider configurations.
- Priority: HIGH.
- Why:
- Existing output line format is difficult to parse.
- Shipper configuration is simplified if logfile output is uniform.
- Indexing configuration is simplified if logfile output is uniform.
- SYSLOG and other transports obviate the need for files, but file output will likely remain the default.
Elastic Stack reference configuration
On the basis of regularized provider configuration and output, and the work of the ONAP Operations Manager project, a complete Elastic Stack pipeline can be deployed automatically.
This achieves two things:
- It demonstrates what has been made possible.
- It provides a ONAP with a viable analytics platform.
The proposal is:
- Filebeat shipping:
- Line format and locations as discussed.
- Other shipping transports are simplified by regularized logger provider configuration.
- Logstash indexing.
- Elasticsearch in a TBD minimal three-node cluster - currently a single container.
- Kibana Discover UI.
- Fullly automated Kubernetes deployment based on ONAP Operations Manager.
- Currently: Available via 20170914 master build
- Affects:
- Adds analytics capability, but no impact on individual ONAP components.
- Reconfiguration, including replacement with OTHER analytics pipelines will be similarly transparent.
- Currently:
- Newlines not escaped.
- Log entry attributes pipe-delimited.
- MDC values pipe-delimited, accessed by ordinal position.
- Delimiters not escaped in messages, MDCs and other values.
- Affects: all logger provider configurations.
- Priority: HIGH.
- Why:
- Existing output line format is difficult to parse.
- Shipper configuration is simplified if logfile output is uniform.
- Indexing configuration is simplified if logfile output is uniform.
- SYSLOG and other transports obviate the need for files, but file output will likely remain the default.
Elastic Stack reference configuration
On the basis of regularized provider configuration and output, and the work of the ONAP Operations Manager project, a complete Elastic Stack pipeline can be deployed automatically.
This achieves two things:
- It demonstrates what has been made possible.
- It provides a ONAP with a viable analytics platform.
The proposal is:
- Filebeat shipping:
- Line format and locations as discussed.
- Other shipping transports are simplified by regularized logger provider configuration.
- Logstash indexing.
- Elasticsearch in a minimal three-node cluster.
- Kibana Discover UI.
- Fullly automated Kubernetes deployment based on ONAP Operations Manager.
- Currently: N/A
- Affects:
- Adds analytics capability, but no impact on individual ONAP components.
- Reconfiguration, including replacement with OTHER analytics pipelines will be similarly transparent.
- Priority: HIGH.
- Why:
- Demonstrates a bolt-on analytics capability.
- Provides a working analytics OOB.
- Elastic Stack is available as FOSS.
- Notes:
- Files + Filebeat are the lowest common denominator. They provide a simple mechanism for resilience, and yet require no disruptive (for example classpath) changes.
- Other sources of logs can be indexed, with appropriate configuration. Generally these will not be able to be correlated with an ONAP transaction, however.
Transactions
Propagate transaction ID
Reliable propagation of transaction identifiers is critical to tracing requests through ONAP.
- Currently: patchy.
- Affects: to be determined, but at least a few components and integration points.
- Why: reliable propagation is a prerequisite for analytics.
- Notes:
This is normally achieved:
- Through MDCs in-process.
- Through REST headers between components. See Rename X-ECOMP-RequestID.
This also requires the generation of transaction IDs in initiating components.
- For this to be economical, a remit is sought to make minor changes across the ONAP codebase.
Rename X-ECOMP-RequestID
Update X-ECOMP-RequestID to X-ONAP-RequestID throughout.
- Currently: X-ECOMP-RequestID.
- Affects: all ONAP components.
- Why: ECOMP renamed to ONAP.
- Notes:
- This may already have been fixed in another branch.
- If not, it can be dealt with at the same time as applying changes to defaults, etc.
Key Project Facts
- Demonstrates a bolt-on analytics capability.
- Provides a working analytics OOB.
- Elastic Stack is available as FOSS.
- Notes:
- Files + Filebeat are the lowest common denominator. They provide a simple mechanism for resilience, and yet require no disruptive (for example classpath) changes.
- Other sources of logs can be indexed, with appropriate configuration. Generally these will not be able to be correlated with an ONAP transaction, however.
...
Transactions
Propagate transaction ID
Reliable propagation of transaction identifiers is critical to tracing requests through ONAP.
- Currently: patchy.
- Affects: to be determined, but at least a few components and integration points.
- Why: reliable propagation is a prerequisite for analytics.
- Notes:
This is normally achieved:
- Through MDCs in-process.
- Through REST headers between components. See Rename X-ECOMP-RequestID.
This also requires the generation of transaction IDs in initiating components.
- For this to be economical, a remit is sought to make minor changes across the ONAP codebase.
Rename X-ECOMP-RequestID
Update X-ECOMP-RequestID to X-ONAP-RequestID throughout.
- Currently: X-ECOMP-RequestID.
- Affects: all ONAP components.
- Why: ECOMP renamed to ONAP.
- Notes:
- This may already have been fixed in another branch.
- If not, it can be dealt with at the same time as applying changes to defaults, etc.
...
Key Project Facts
- Repository: logging-analytics
- Mirror: https://github.com/onap
- Jenkins: https://jenkins.onap.org/view/logging-analytics/
- Sonar: https://sonar.onap.org/dashboard?id=org.onap.logging-analytics%3Alogging-analytics
- nexus-IQ: https://nexus-iq.wl.linuxfoundation.org/assets/index.html#/reports/logging-analytics/cead786ad2ac408c884d6cb790ae7e91
- JIRA project name: logging-analytics
- JIRA project prefix: LOG
- Mailing list tag: log
- Project Lead: Prudence Au / Backup/co-PTL: Luke Parker
- Committers (Name - email) Resources and Repositories (Deprecated)#LoggingEnhancements
- Luke Parker - luke.parker@amdocs.com
- Avdhut Kholkar - avdhut.kholkar@amdocs.com
- Prudence Au
- Lee Breslau - breslau@research.att.com (alumni)
- Contributors (in order of last contribution)
- Michael O'Brien - michael@obrienlabs.cloud
- Michael O'Brien - frank.obrien@amdocs.com
- Steve Smokowski
- Lorraine Welch
- Dave Williamson
- Shishir Thakore
- Liang Ke
- James MacNider
- Shane Daniel
- J. Ram Balasubramanian
- Geora Barsky
- Borislav Glozman
- Yury Novitsky
- Stela Stoykova
- Alka Choudhary
- Anup Marathe
- Pranav Dixit
- Vidya Shinde
- Itay Hassid
- Matthew Harfy
- Karen Joseph
- Repository: logging-analytics
- JIRA project name: logging-analytics
- JIRA project prefix: LOG
- Mailing list tag: log
- Project Lead: Mark Pond (mpond@amdocs.com) / Luke Parker
- Committers (Name - email)
- Luke Parker - luke.parker@amdocs.com
- Avdhut Kholkar - avdhut.kholkar@amdocs.com
- Lee Breslau - breslau@research.att.com
- Daniel Milani - daniel.milani@bell.ca
- Jerome Doucerain - jerome.doucerain@bell.ca
...
Resources
Existing logging guidelines:
...
- Elastic Stack - https://www.elastic.co/products
- Filebeat - https://www.elastic.co/products/beats/filebeat
https://www.elastic.co/products/beats/filebeatvideos/getting-started-with-filebeat?baymax=rtp&storm=beats&elektra=product&iesrc=ctr - Logstash - https://www.elastic.co/products/logstash
- Kibana Discover - https://www.elastic.co/guide/en/kibana/current/discover.html
- FOSS Description for Logging Enhancements
ONAP Operations Manager: ONAP Operations Manager Project
OPNFV: https://wiki.opnfv.org/display/doctor
https://kubernetes.io/docs/concepts/cluster-administration/logging/