...
ONAP on Kubernetes#QuickstartInstallation

Kubernetes
Monitoring
Grafana Dashboards
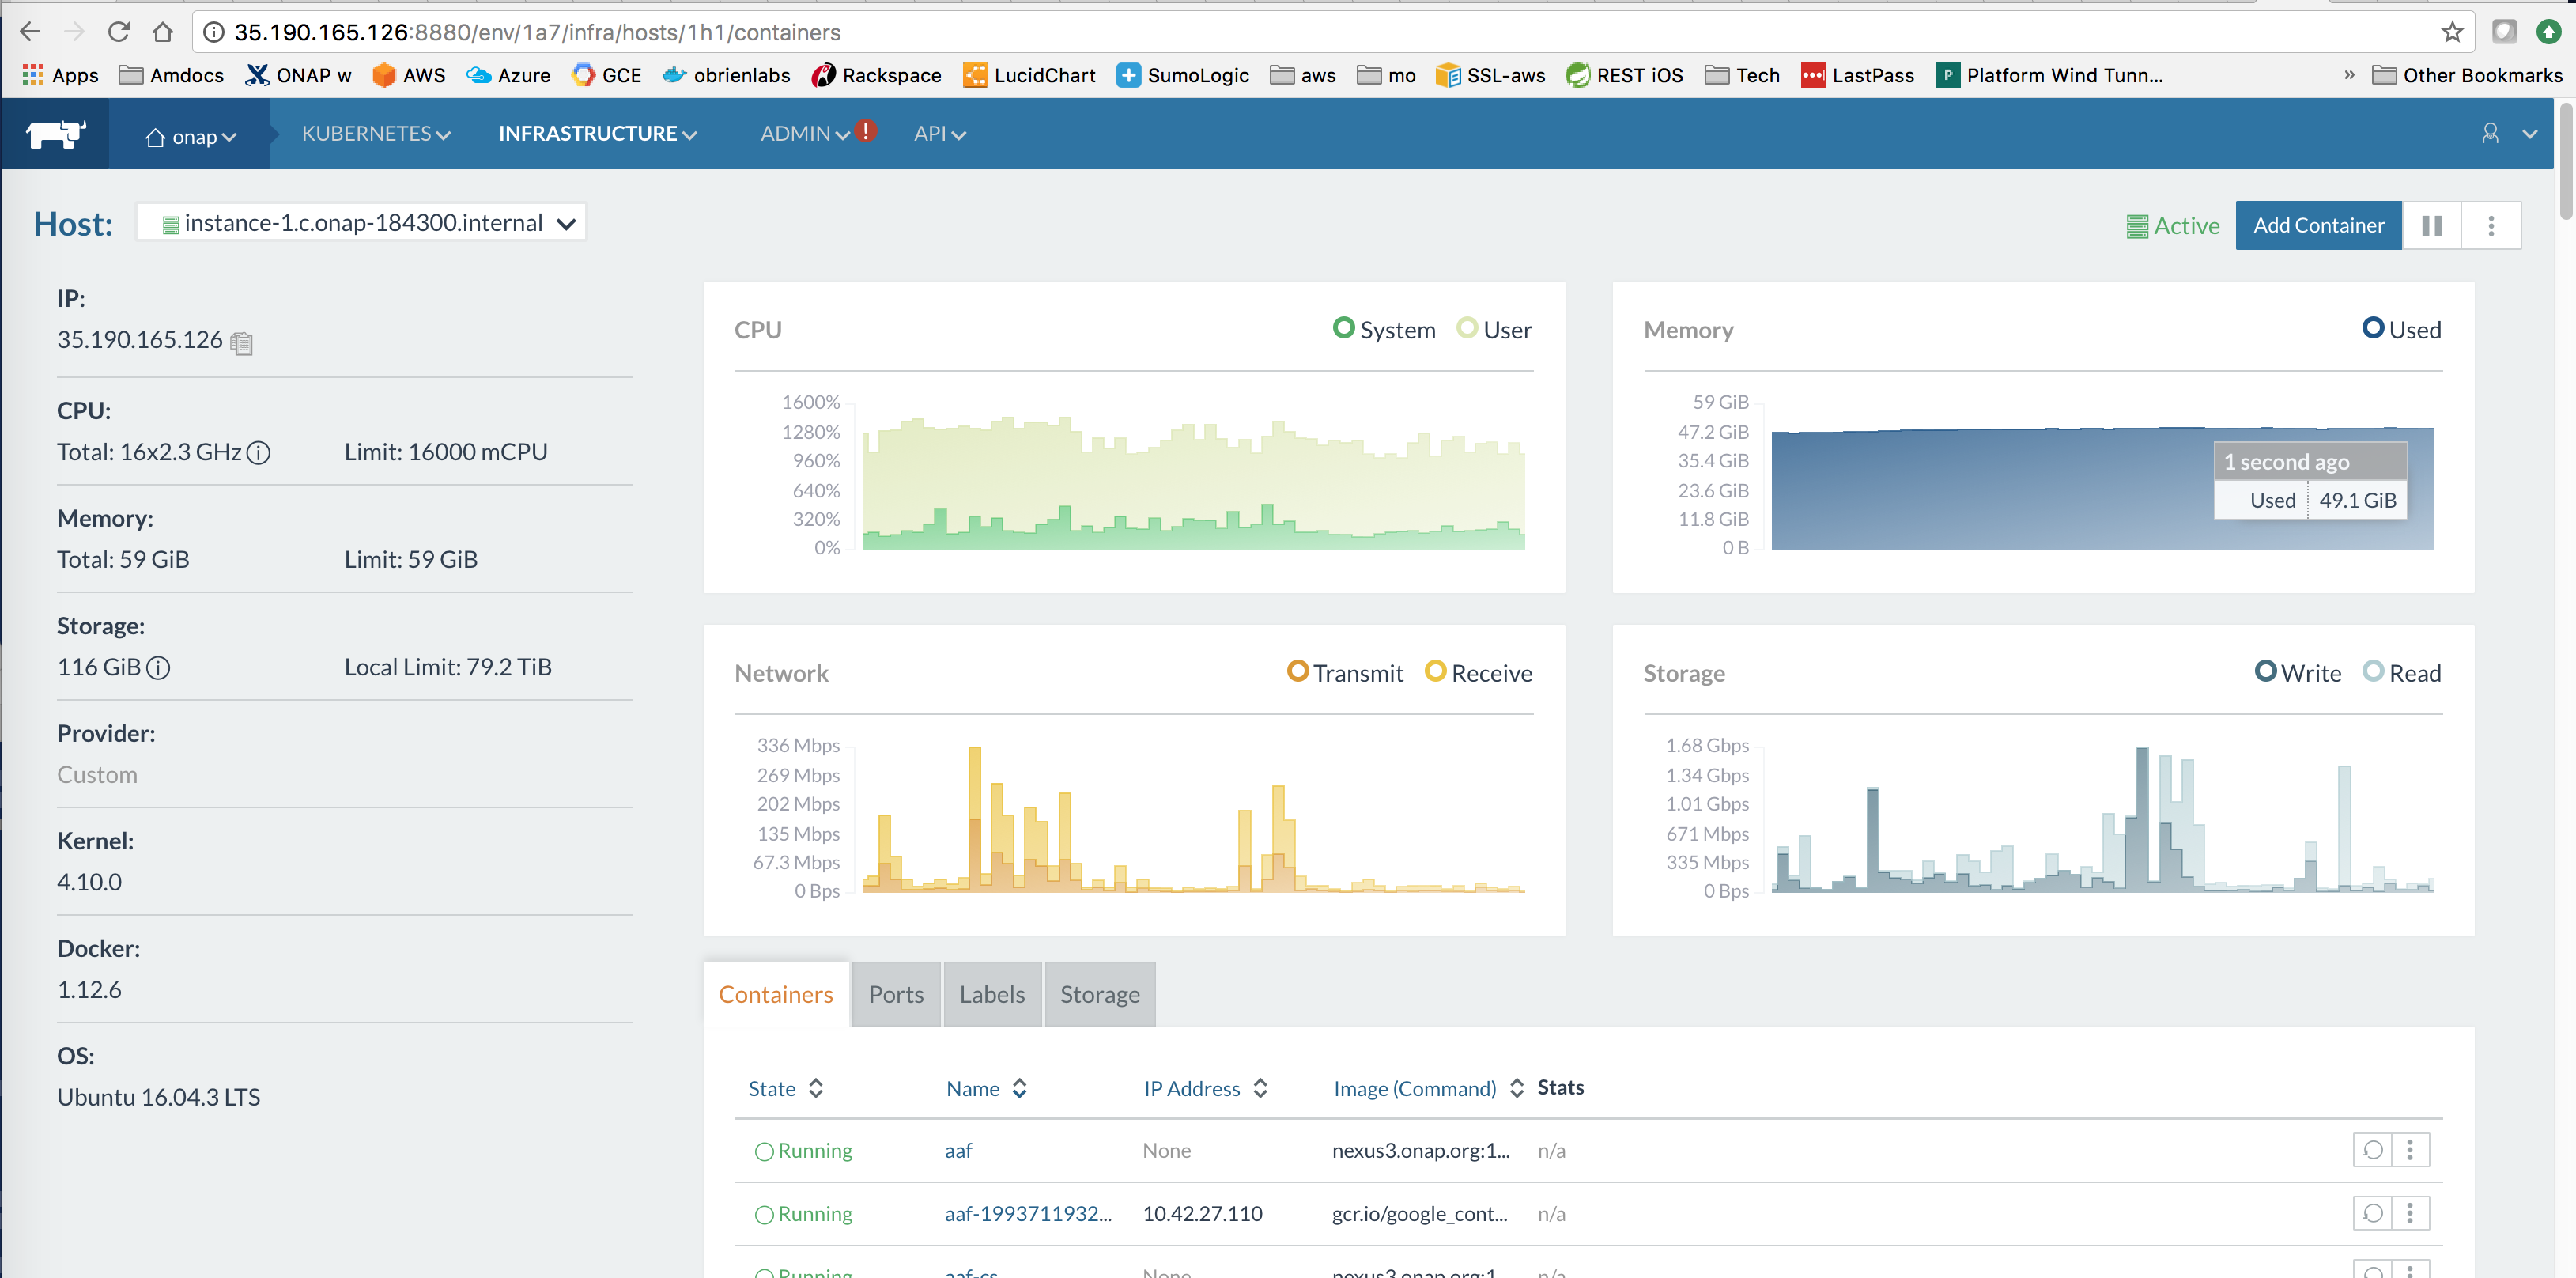
There is a built in grafana dashboard (thanks Mandeep Khinda ) that once enabled can show more detail about the cluster you are running - you need to expose the nodeport and target the VM the pod is on.
The CD system one is running below http://master3.onap.info:32628/dashboard/db/cluster?orgId=1&from=now-12h&to=now
| Code Block | ||
|---|---|---|
| ||
# expose the nodeport
ubuntu@ip-10-0-0-169:~$ kubectl expose -n kube-system deployment monitoring-grafana --type=LoadBalancer --name monitoring-grafana-client
service "monitoring-grafana-client" exposed
# get the nodeport pod is running on
ubuntu@ip-10-0-0-169:~$ kubectl get services --all-namespaces -o wide | grep graf
kube-system   monitoring-grafana          ClusterIP      10.43.44.197    <none>                                 80/TCP                                                                       7d        k8s-app=grafana
kube-system   monitoring-grafana-client   LoadBalancer   10.43.251.214   18.222.4.161                           3000:32628/TCP                                                               15s       k8s-app=grafana,task=monitoring
# get the cluster vm DNS name
ubuntu@ip-10-0-0-169:~$ kubectl get pods --all-namespaces -o wide | grep graf
kube-system monitoring-grafana-997796fcf-7kkl4 1/1 Running 0 5d 10.42.84.138 ip-10-0-0-80.us-east-2.compute.internal |

Kubernetes DevOps
downgrade docker if required
...