Introduction
The SO-Monitoring component allows a user to have a detailed monitoring view of the Camunda BPMN workflows that have run, or are running, in SO. It provides a frontend UI that allows users to easily go through a workflow’s different calls and drill up/down through the call activities within the workflow. It also provides a search page for filtering specific results. It allows you to filter by start/end time/date, instance id, request id, service name or by the status of a workflow. The component is extremely useful for debugging and testing workflows of any kind, as it delivers an understandable and simple UI which is much easier to follow than large cumbersome debug log files. Additionally the UI provides a statistics page, based on your current search parameters, that provides the percentages of complete, failed, in progress, pending and unlocked workflows.
Using SO-Monitoring
In order to make use of SO-Monitoring currently, you will need to onboard the application in the ONAP portal. This can be done using the host name “so-monitoring” or the direct IP linked to the SO-Monitoring service, and the port number, which by default is “9091”. First you need to make sure you can access the ONAP portal, this is done by adding:
<onapIp> portal.api.simpledemo.onap.org
Replacing <onapIp> with the IP To a blank link on your hosts file, usually found in “C:\Windows\System32\drivers\etc”. Ensure you open the host file as an administrator, or you will unable to edit it.
Steps to add SO-Monitoring to the Portal:
- Log into your ONAP Portal as the super user
Login: demo
Password: demo123456!
- Click “Application Onboarding”, then “Add App” in the top right.
- Fill out the required Application Details (Name, URL, REST API URL, Username, Password) as shown here:
- Application Name: Monitoring
- URL: http://so-monitoring:9091
- Rest API URL: http://so-monitoring:9091/so/monitoring/v1/search
- Username: user
- Password: password

- Please note, the Application Name, Username and Password can be given any values currently.
- Now simply go to the “Application Catalog” tab on the left of the page, then tick your Monitoring app to enable it. (Whatever you set Application Name as should show up here.)
- Click the “Home” tab and you should be able to access the Monitoring app now.
Searching/Viewing BPMN Workflows
SO-Monitoring Search UI

In order to find the workflow that you are attempting to monitor you will need at least one of the following values of the service instance: Service Instance ID, Request ID, Service Name or the time/date range in which the workflow started/ended. You can use the filter drop-down boxes to the left of the parameter boxes, i.e. “EQUAL”, “NOT EQUAL” and “LIKE” to search for items equal to, not equal to or similiar to your parameter. Also, you can filter by the status of a workflow, with the status drop-down box, to further filter your results. Simply enter any of these pieces of information into the search page, ensure the start and end date range includes when the workflow would have run and press the search button. Once your results list has been returned you can click on the results to see the workflow in the graphical BPMN viewer.
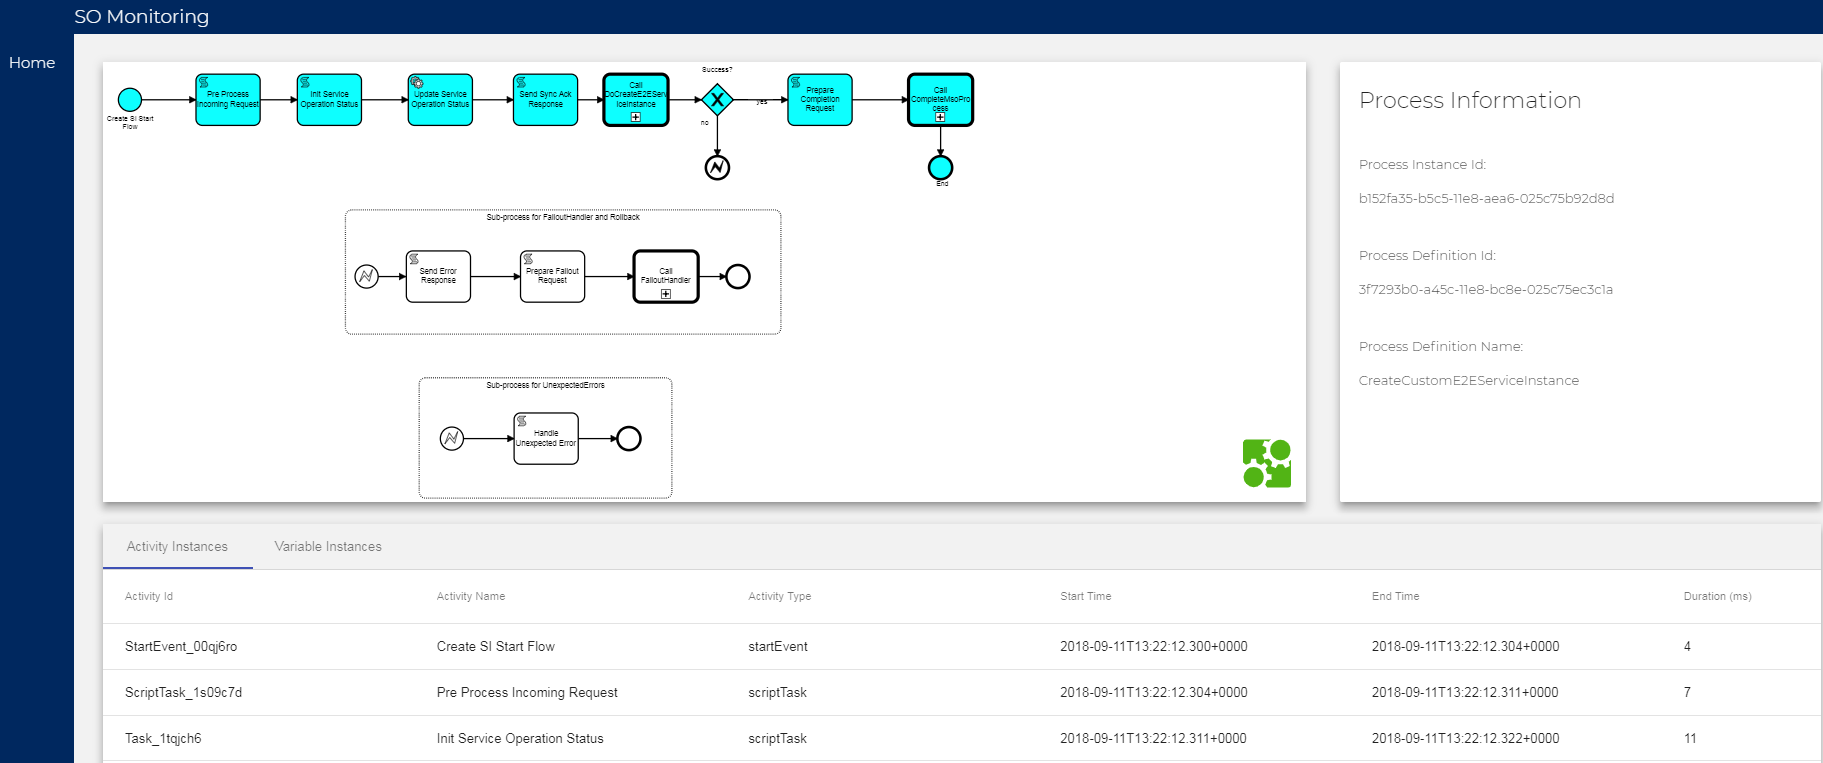
From here you can inspect the different calls and variables throughout the workflow, by using the "Activity Instances" and "Variable Instances" tabs. Clicking on one of the sub process call, within the diagram, to open them in the graphical BPMN viewer (The boxes with a + at the bottom of them are call activities to sub processes. This is how you drill down through a workflow, you can also safely traverse back “up” through the flows with your browser’s back button. The cyan highlighting shows the flow of the path taken by the workflow, and this will go down through each of the sub processes as well.
SO-Monitoring Service Statistics
You can see a summary of the status of all of the workflows from one of your search results by clicking on the "Service Statistics" tab, found just above your list of results. Here you can find a percentile breakdown of each workflow's, in the list of results you received, statuses.

Troubleshooting SO-Monitoring
Log files
The log files for SO-Monitoring can be found within the SO-Monitoring pod. They will be located in the “/app/logs/so-monitoring” directory. You will find a debug, error, metric and audit log file here. They each contain differing information, except the debug log file which will contain all of the logging information. Alternatively you can get the logs from the SO-Monitoring pod itself when using Kubernetes. Using the command:
“kubectl -n <namespace> logs <soMonitoringPodName>”
Replacing <namespace> with your environments namespace and <soMonitoringPodName> with the full name of your SO-Monitoring pod. This command will give you some detailed information from the execution of the pod.