Originally in the logging specification ONAP Application Logging Specification v1.2 (Casablanca) - but will be cross specification releases - so a separate guide.
See additional developer/deployment oriented details on ONAP Development
Luke Parker has added a logging library and example project that exposes a 3rd party jar in nexus.onap.org at
Do we need to use this library? good question – you have 4 options (unchanged, do your own code changes/library, use the SLF4J library from Luke (includes MDC/Marker support) or use the AOP (WIP) wrapper on the SLF4J library – it uses aspects to (so-far) add ENTRY/EXIT marker (labelled) logs for each function call in scope. Using the library is optional – the goal is to reduce the amount of work teams need to do to adhere to the new MDC/Marker specification for Casablanca.
There are developer details on using the libraries (pom.xml edits, spring AOP additions) and how to deploy the logdemo pod alongside onap that demos using the libraries
The code is ready for use as we finish the library (java is most up to date for now, python is in progress)
https://git.onap.org/logging-analytics/tree/reference
The demo RI stack
oom kubernetes chart
https://git.onap.org/logging-analytics/tree/reference/logging-kubernetes
docker build
https://git.onap.org/logging-analytics/tree/reference/logging-docker-root/logging-docker-demo
war
https://git.onap.org/logging-analytics/tree/reference/logging-demo
aop library
https://git.onap.org/logging-analytics/tree/reference/logging-library
slf4j library
https://git.onap.org/logging-analytics/tree/reference/logging-slf4j
Overall Logging and ELK Architecture
Log Locations and Volumes
Adding Filebeat to an ONAP Kubernetes POD
See commit https://gerrit.onap.org/r/#/c/57171/ for LOG-137 - Getting issue details... STATUS for reference
Artifacts
Consumed
Logging Library JAR
Logging Library AOP wrapper JAR
logback.xml
filebeat.yml
Produced
Microservice WAR - using the Logging Library AOP JAR
DockerFile
Helm Charts for Kubernetes
Python: pylog Library
JAVA: Adding Logging to a WAR Project
Logback.xml
place in src/main/java/resources
based off https://git.onap.org/logging-analytics/tree/reference/logging-slf4j/src/test/resources/logback.xml
But don't use this file yet until it is finished testing and the indexing is modified on the ELK side - https://gerrit.onap.org/r/#/c/57171/
Until then you can continue to use the same logback.xml used by other components that already log like portal/policy/aai/vid/clamp
https://gerrit.onap.org/r/#/c/62405
#20180925
<!-- MDC and MARKER specific for Cassablanca -->
<property name="LogTimestamp" value="%d{"yyyy-MM-dd'T'HH:mm:ss.SSSXXX", UTC}"/>
<property name="Level" value="%.-5level"/>
<property name="Logger" value="%logger"/>
<property name="Mdc" value="%replace(%replace(%mdc){'\t','\\\\t'}){'\n','\\\\n'}"/>
<property name="Message" value="%replace(%replace(%msg){'\t','\\\\t'}){'\n','\\\\n'}"/>
<property name="RootException" value="%replace(%replace(%rootException){'\t', '\\\\t'}){'\n','\\\\n'}"/>
<property name="Marker" value="%replace(%replace(%marker){'\t','\\\\t'}){'\n','\\\\n'}"/>
<property name="Thread" value="%thread"/>
<!-- indexed -->
<!-- for Casablanca we support both position dependent pipe delimited - and position independent KVP MDCs -->
<property name="p_1_LogTimestamp" value="${LogTimestamp}" />
<property name="p_2_EntryTimestamp" value="%X{EntryTimestamp}" />
<property name="p_3_InvokeTimestamp" value="%X{InvokeTimestamp}" />
<property name="p_4_RequestID" value="%X{RequestId}" />
<property name="p_5_InvocationID" value="%X{InvocationId}" />
<property name="p_6_InstanceID" value="%X{InstanceUUID}" /> <!-- previously InstanceUUID -->
<property name="p_7_ServiceInstanceID" value="%X{ServiceInstanceId}" />
<property name="p_8_thread" value="${Thread}" />
<property name="p_9_ServiceName" value="%X{ServiceName}" />
<property name="p_10_PartnerName" value="%X{PartnerName}" />
<property name="p_11_StatusCode" value="%X{StatusCode}" />
<property name="p_12_ResponseCode" value="%X{ResponseCode}" />
<property name="p_13_ResponseDesc" value="%X{ResponseDesc}" />
<property name="p_14_level" value="${Level}" />
<property name="p_15_Severity" value="%X{Severity}" />
<property name="p_16_ServerIPAddress" value="%X{ServerIPAddress}" />
<property name="p_17_ElapsedTime" value="%X{ElapsedTime}" />
<property name="p_18_ServerFQDN" value="%X{ServerFQDN}" />
<property name="p_19_ClientIPAddress" value="%X{ClientIPAddress}" />
<property name="p_20_VirtualServerName" value="%X{VirtualServerName}" />
<property name="p_21_ContextName" value="%X{ContextName}" />
<property name="p_22_TargetEntity" value="%X{TargetEntity}" />
<property name="p_23_TargetServiceName" value="%X{TargetServiceName}" />
<property name="p_24_TargetElement" value="%X{TargetElement}" />
<property name="p_25_User" value="%X{User}" />
<property name="p_26_logger" value="${Logger}" />
<property name="p_27_mdc" value="${Mdc}" />
<property name="p_28_message" value="${Message}" />
<property name="p_29_marker" value="${Marker}" />
<property name="pattern"
value="%nopexception${p_1_LogTimestamp}|${p_2_EntryTimestamp}|${p_3_InvokeTimestamp}|${p_4_RequestID}|${p_5_InvocationID}|${p_6_InstanceID}|${p_7_ServiceInstanceID}|${p_8_thread}|${p_9_ServiceName}|${p_10_PartnerName}|${p_11_StatusCode}|${p_12_ResponseCode}|${p_13_ResponseDesc}|${p_14_level}|${p_15_Severity}|${p_16_ServerIPAddress}|${p_17_ElapsedTime}|${p_18_ServerFQDN}|${p_19_ClientIPAddress}|${p_20_VirtualServerName}|${p_21_ContextName}|${p_22_TargetEntity}|${p_23_TargetServiceName}|${p_24_TargetElement}|${p_25_User}|${p_26_logger}|${p_27_mdc}|${p_28_message}|${p_29_marker}%n" />
spring.xml
<aop:aspectj-autoproxy />
<beans>
        <bean class="org.onap.demo.logging.LoggingAspect" /> <!-- required even though we annotate with @Aspect -->
</beans>
pom.xml
Add the following
<logback.version>1.2.3</logback.version>
<dependency>
	<groupId>ch.qos.logback</groupId>
	<artifactId>logback-core</artifactId>
	<version>${logback.version}</version>
</dependency>
<dependency>
	<groupId>ch.qos.logback</groupId>
	<artifactId>logback-classic</artifactId>
	<version>${logback.version}</version>
</dependency>
<dependency>
    <groupId>org.springframework</groupId>
    <artifactId>spring-aop</artifactId>
    <version>${spring.version}</version>
</dependency>


# add the logging library pom (soon to be 1.2.2)
<dependency>
  <groupId>org.onap.logging-analytics</groupId>
  <artifactId>logging-slf4j</artifactId>
  <version>1.2.0-SNAPSHOT</version>
</dependency>
Logging With AOP
LOG-135 - Getting issue details... STATUS
Class under Test
Prototyped AOP advice around Luke's library - minimal client changes - just an aspect bean and annotations required
import javax.servlet.http.HttpServletRequest;
import org.slf4j.LoggerFactory;
import org.springframework.stereotype.Service;
@Service("daoFacade")
public class ApplicationService implements ApplicationServiceLocal {
    @Override
    public Boolean health(HttpServletRequest servletRequest) {
    	Boolean health = true;
    	// TODO: check database
    	// Log outside the AOP framework - to simulate existing component logs between the ENTRY/EXIT markers
    	LoggerFactory.getLogger(this.getClass()).info("Running /health");
    	return health;
    }
}
Aspect References
package org.onap.demo.logging;
import javax.servlet.http.HttpServletRequest;
import org.aspectj.lang.JoinPoint;
import org.aspectj.lang.annotation.Aspect;
import org.aspectj.lang.annotation.Before;
import org.onap.logging.ref.slf4j.ONAPLogAdapter;
import org.slf4j.LoggerFactory;

@Aspect
public class LoggingAspect {
    @Before("execution(* org.onap.demo.logging.*.*(..))")
    public void logBefore(JoinPoint joinPoint) {
        Object[] args = joinPoint.getArgs();
        Object servletRequest = args[0];
        ONAPLogAdapter.HttpServletRequestAdapter requestAdapter =
                new ONAPLogAdapter.HttpServletRequestAdapter((HttpServletRequest)servletRequest);
        final ONAPLogAdapter adapter = new ONAPLogAdapter(
                LoggerFactory.getLogger(joinPoint.getTarget().getClass()));
        try {
            adapter.entering(requestAdapter);
        } finally {
        }
    }

    @After("execution(* org.onap.demo.logging.*.*(..))")
    public void logAfter(JoinPoint joinPoint) {
        final ONAPLogAdapter adapter = new ONAPLogAdapter(
                LoggerFactory.getLogger(joinPoint.getTarget().getClass()));
        adapter.exiting();
    }
Logging Demo REST API
curl http://dev.onap.info:30453/logging-demo/rest/health/health
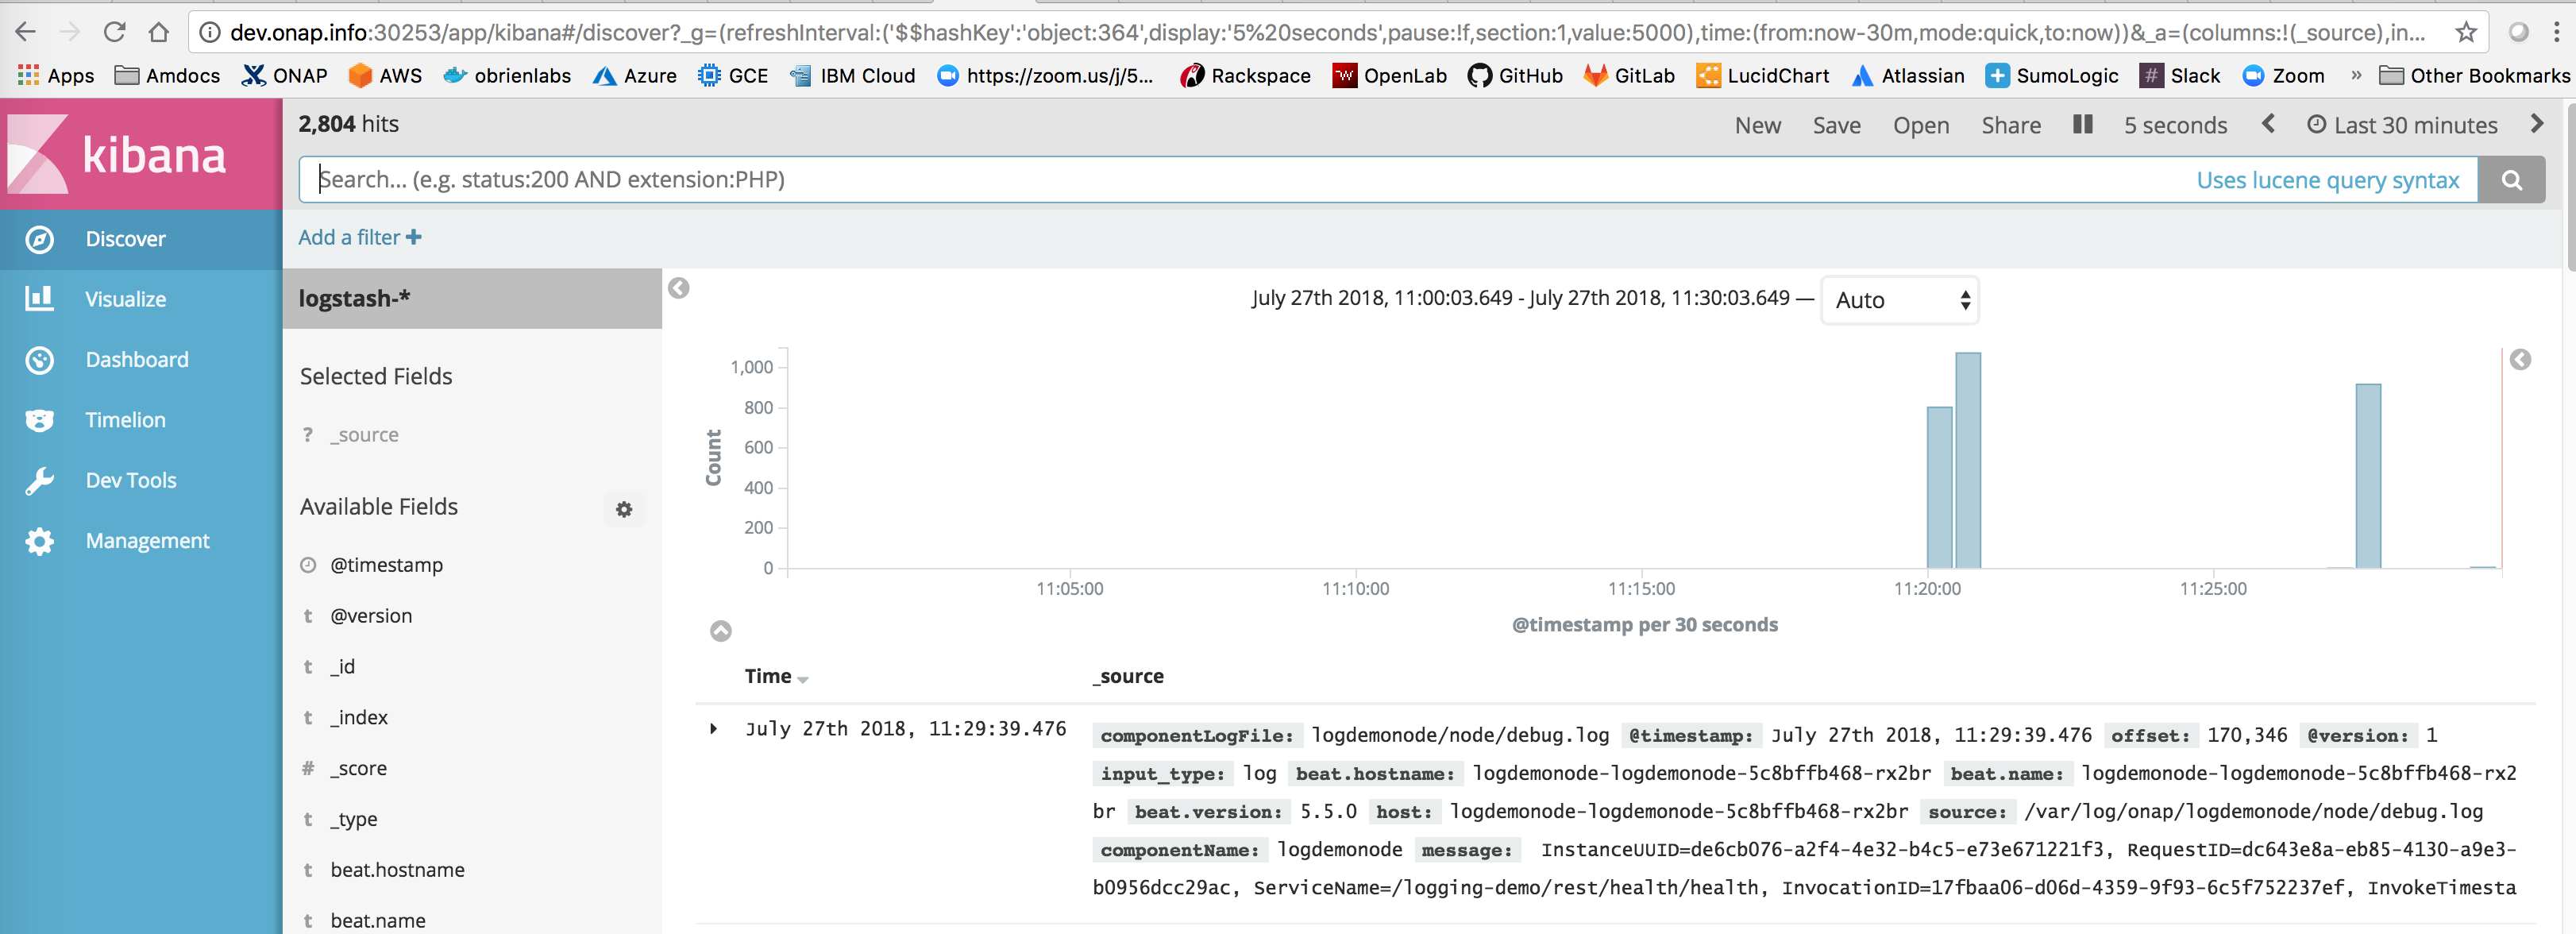
Logging Results
Use Case: Single REST call - with ENTRY/EXIT Markers around in-method log
The key here is that you get logs for free - the entry/exit lines are generated - the line in the middle is from java application code
results - still working on passing in the servlet request
INFO: Reloading Context with name [/logging-demo] is completed
2018-07-09T14:48:01.014Z	http-nio-8080-exec-8	INFO	org.onap.demo.logging.ApplicationService
 InstanceUUID=67bc4b12-56a1-4b62-ab78-0c8ca8834383,
 RequestID=023af35a-b281-49c4-bf13-5167b1453780,
 ServiceName=/logging-demo/rest/health/health,
 InvocationID=94dc9e24-3722-43e5-8995-12f95e153ca3,
 InvokeTimestamp=2018-07-09T14:48:01.008Z,
 PartnerName=,
 ClientIPAddress=0:0:0:0:0:0:0:1,
 ServerFQDN=localhost			ENTRY
2018-07-09T14:48:01.014Z	http-nio-8080-exec-8	INFO	org.onap.demo.logging.ApplicationService
 InstanceUUID=67bc4b12-56a1-4b62-ab78-0c8ca8834383,
 RequestID=023af35a-b281-49c4-bf13-5167b1453780,
 ServiceName=/logging-demo/rest/health/health,
 InvocationID=94dc9e24-3722-43e5-8995-12f95e153ca3,
 InvokeTimestamp=2018-07-09T14:48:01.008Z,
 PartnerName=,
 ClientIPAddress=0:0:0:0:0:0:0:1,
 ServerFQDN=localhost	Running /health
2018-07-09T14:48:01.015Z	http-nio-8080-exec-8	INFO	org.onap.demo.logging.ApplicationService
 ResponseCode=,
 InstanceUUID=67bc4b12-56a1-4b62-ab78-0c8ca8834383,
 RequestID=023af35a-b281-49c4-bf13-5167b1453780,
 ServiceName=/logging-demo/rest/health/health,
 ResponseDescription=,
 InvocationID=94dc9e24-3722-43e5-8995-12f95e153ca3,
 Severity=,
 InvokeTimestamp=2018-07-09T14:48:01.008Z,
 PartnerName=,
 ClientIPAddress=0:0:0:0:0:0:0:1,
 ServerFQDN=localhost,
 StatusCode=			EXIT
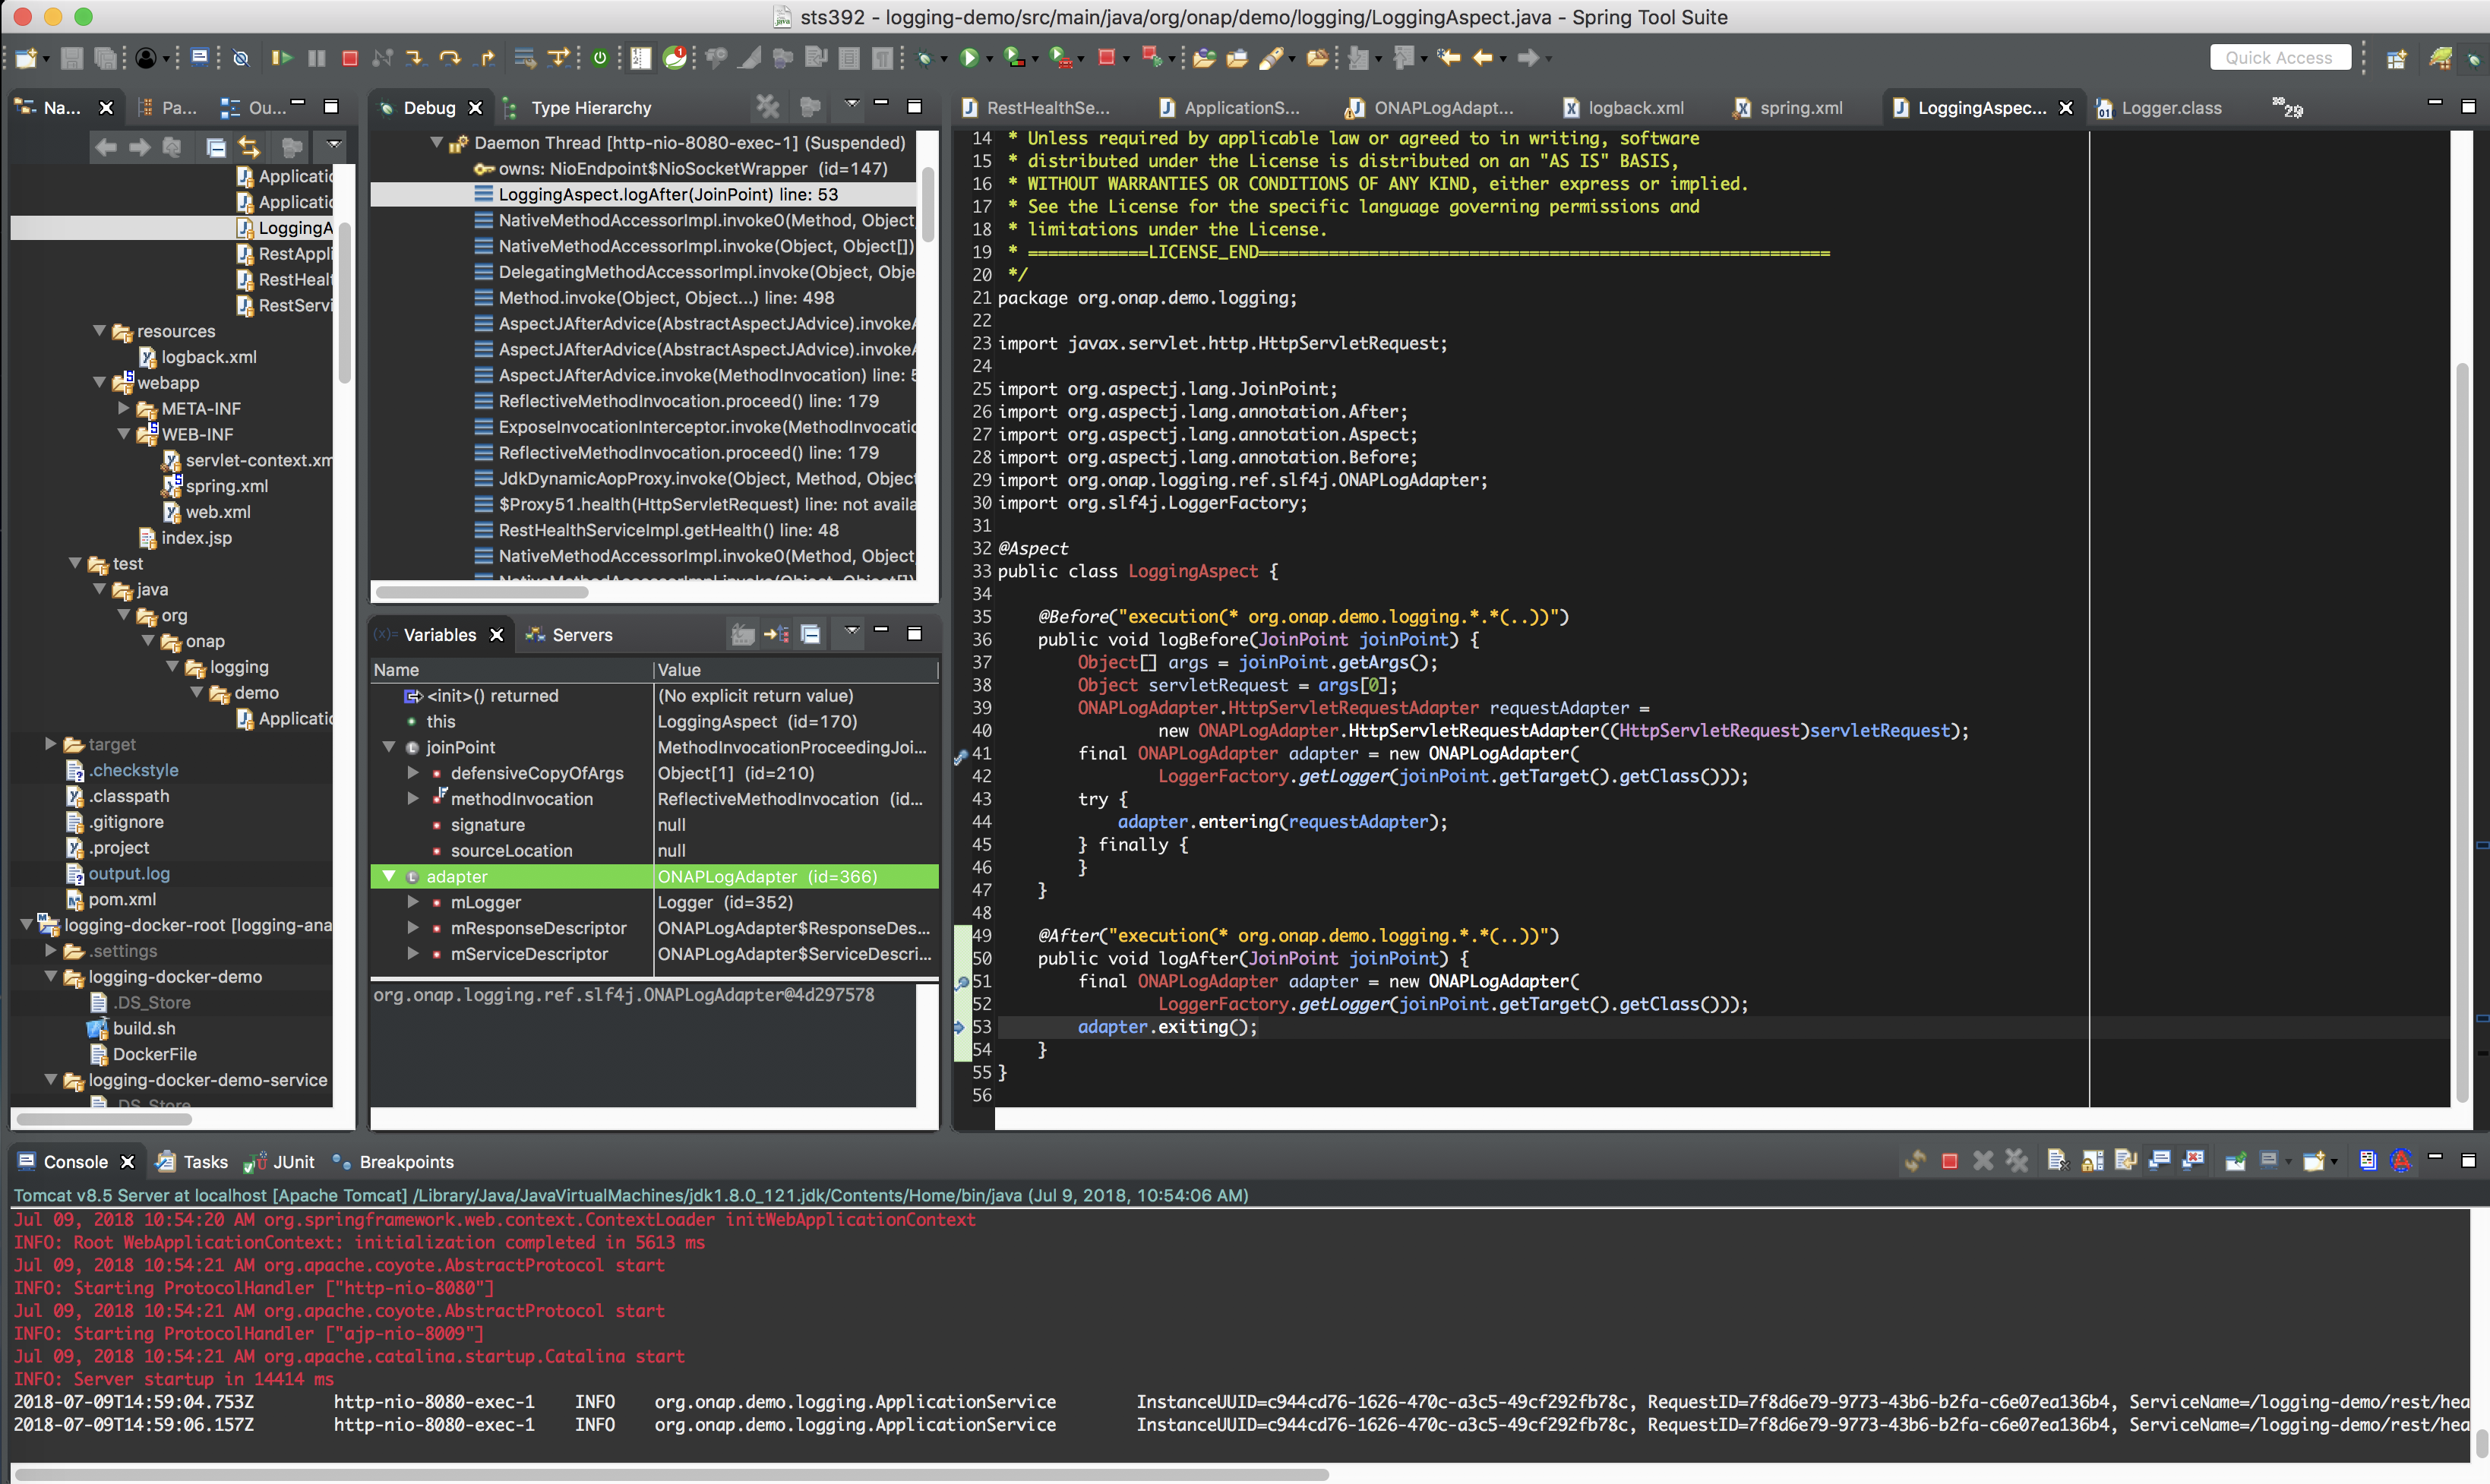
AOP Stacktrace - logBefore()
Tomcat v8.5 Server at localhost [Apache Tomcat]
	org.apache.catalina.startup.Bootstrap at localhost:51622
		Daemon Thread [http-nio-8080-exec-1] (Suspended (breakpoint at line 41 in LoggingAspect))
			owns: NioEndpoint$NioSocketWrapper  (id=147)
			LoggingAspect.logBefore(JoinPoint) line: 41
			NativeMethodAccessorImpl.invoke0(Method, Object, Object[]) line: not available [native method]
			NativeMethodAccessorImpl.invoke(Object, Object[]) line: 62
			DelegatingMethodAccessorImpl.invoke(Object, Object[]) line: 43
			Method.invoke(Object, Object...) line: 498
			AspectJMethodBeforeAdvice(AbstractAspectJAdvice).invokeAdviceMethodWithGivenArgs(Object[]) line: 629
			AspectJMethodBeforeAdvice(AbstractAspectJAdvice).invokeAdviceMethod(JoinPointMatch, Object, Throwable) line: 611
			AspectJMethodBeforeAdvice.before(Method, Object[], Object) line: 43
			MethodBeforeAdviceInterceptor.invoke(MethodInvocation) line: 51
			JdkDynamicAopProxy.invoke(Object, Method, Object[]) line: 213
			$Proxy51.health(HttpServletRequest) line: not available
			RestHealthServiceImpl.getHealth() line: 48
			ServerRuntime$2.run() line: 326
			WebComponent.service(URI, URI, HttpServletRequest, HttpServletResponse) line: 427
			ServletContainer.service(URI, URI, HttpServletRequest, HttpServletResponse) line: 388
Deployment
Deploying demo pod
Helm Deployment
also as of 20180918 use Mike Elliott s plugin - https://gerrit.onap.org/r/#/c/67071/ at OOM Helm (un)Deploy plugins
# prereq
- Makefile in k8s root - copied/modified-parent-chart from https://git.onap.org/oom/tree/kubernetes/Makefile
- oom and logging-analytics cloned
sudo git clone https://gerrit.onap.org/r/oom
sudo git clone https://gerrit.onap.org/r/logging-analytics
cd logging-analytics
# pull patch in progress
sudo git pull https://gerrit.onap.org/r/logging-analytics refs/changes/71/57171/9
# install onap log
/oom/kubernetes$ sudo helm delete --purge onap
/oom/kubernetes$ sudo make all
/oom/kubernetes$ sudo make onap
/oom/kubernetes$ sudo helm install local/onap -n onap --namespace onap -f onap/resources/environments/disable-allcharts.yaml --set log.enabled=false
/oom/kubernetes$ sudo helm upgrade -i onap local/onap --namespace onap -f onap/resources/environments/disable-allcharts.yaml --set log.enabled=true

# install logdemo
/logging-analytics/reference/logging-kubernetes$ sudo helm delete --purge logdemonode
/logging-analytics/reference/logging-kubernetes$ sudo make all
/logging-analytics/reference/logging-kubernetes$ sudo make logdemonode
/logging-analytics/reference/logging-kubernetes$ sudo helm install local/logdemonode -n logdemonode --namespace onap --set logdemonode.enabled=true

# rebuild after code change
/logging-analytics/reference/logging-kubernetes$ sudo helm upgrade -i logdemonode local/logdemonode --namespace onap --set logdemonode.enabled=false

# results
onap          logdemonode-logdemonode-5c8bffb468-rx2br   2/2       Running   0          1m
onap          onap-log-elasticsearch-7557486bc4-9h7gf    1/1       Running   0          40m
onap          onap-log-kibana-fc88b6b79-rkpzx            1/1       Running   0          40m
onap          onap-log-logstash-fpzc5                    1/1       Running   0          40m

onap          log-es                 NodePort    10.43.17.89     <none>        9200:30254/TCP   39m
onap          log-es-tcp             ClusterIP   10.43.120.133   <none>        9300/TCP         39m
onap          log-kibana             NodePort    10.43.73.68     <none>        5601:30253/TCP   39m
onap          log-ls                 NodePort    10.43.107.55    <none>        5044:30255/TCP   39m
onap          log-ls-http            ClusterIP   10.43.48.177    <none>        9600/TCP         39m
onap          logdemonode            NodePort    10.43.0.35      <none>        8080:30453/TCP   55s
ubuntu@ip-172-31-54-73:~$ curl http://dev.onap.info:30453/logging-demo/rest/health/health
true
# check records in elasticsearch
ubuntu@ip-172-31-54-73:~$ curl http://dev.onap.info:30254/_search?q=*
{"took":3,"timed_out":false,"_shards":{"total":21,"successful":21,"failed":0},"hits":{"total":2385953,"max_score":1.0,"hits":[{"_index":".kibana","_type":"index-pattern","_id":"logstash-*","_score":1.0,"_source":{"title":"logstash-*","timeFieldName":"@timestamp","notExpandable":true,"fields":"[{\"name\":\"@timestamp\",\"type\":\"date\",\"count\":0,\


# note if PV's are left over (a helm 2.9.1 issue after an upgrade from Kubernetes 1.8 to 1.10 via Rancher 1.6.18 - add a delete namespace
sudo helm delete --purge onap
kubectl delete namespace onap
kubectl delete pv --all
kubectl delete pvc --all
kubectl delete secrets --all
kubectl delete clusterrolebindings --all
FAQ / Workarounds
Issue: Logs not appearing in the ELK stack
Check that your volumeMounts are correct in both your application container and filebeat container - for example there must be a /var/log/onap in both
          volumeMounts:
          - name: {{ include "common.fullname" . }}-logs
            mountPath: /var/log/onap
Issue: DNS error pushing logs from filebeat to logstash
Check that your config section in values.yaml either at the helm root or subchart level define the service name and port
config:
  logstashServiceName: log-ls
  logstashPort: 5044
ELK Configuration
Logstash
Grok
LOG-490 - Getting issue details... STATUS
ElasticSearch
Kibana
Design Issues
DI 8: Log Collection
Currently log collection occurs via the filebeat sidecar container. There is 1 container per pod that pushes logs from the emptydir PV volume to logstash.
DI 8: LOG-587: Refactoring filebeat to run as a per VM DaemonSet deployment
There is an optimization that can be prototyped where we instead push logs directly from each cluster VM right from the kubelet logs containing the PV's for each container on that VM - via a DaemonSet filebeat container (1 per VM instead of 1 per microservice)
The logstash container was recently changed to a DaemonSet deployment - use this as a chart reference
Example of where logs are put for the emptyDir PV
ubuntu@ip-172-31-55-235:~/_dev/20180712-log-137/oom/kubernetes$ sudo ls /var/lib/kubelet/pods/b3f9e7bc-8d79-11e8-969d-02a1d5a57c25/volumes/kubernetes.io~empty-dir/onap-logdemonode-logs/logdemonode/node -la
-rw-r--r-- 1 root root    0 Jul 22 06:37 audit.log
-rw-r--r-- 1 root root  548 Jul 22 07:01 debug.log
-rw-r--r-- 1 root root    0 Jul 22 06:37 error.log
-rw-r--r-- 1 root root    0 Jul 22 06:37 metrics.log
under the following
LOG-587 - Getting issue details... STATUS
Logstash is already a DaemonSet – you can use that as the deployment part of the example (small change) – the larger piece will be to point filebeat to a subset of the emptyDir PV directory or target individual pod PVs on that VM for log shipping.
for example you will need to correlate the PV UUID on the VM with the kubernetes deployment pod id to map the correct pod to it’s emptyDir pv – or just push everything appearing in the kubelet dir.
I am hoping that a switch of the service to a DaemonSet – a one line change and blind pushing of all or a subset (minus the kubernetes/rancher/Grafana pods) of the volumes/kubernetes.io~empty-dir would be sufficient.
2 Comments
Michael O'Brien
to retrofit into docs
LOG-630 - Getting issue details... STATUS
in logback.xml the ENV variable is set as a helm values prop or as a JVM env variable (developers)
<property name="logDirPrefix" value="${logDirRoot}/log/onap"></property>
in values.yaml
logDirRoot: /var
in deployment.yaml
         env:

             #Example environment variable passed to container

            - name: DEBUG_FLAG

              value: {{ .Values.global.debugEnabled | default .Values.debugEnabled | quote }}

            - name: logDirRoot

              value: {{ .Values.global.logDirRoot | default .Values.logDirRoot | quote }}
check ENV var in container
ubuntu@ip-172-31-48-194:~$ kubectl exec -it logdemonode-logdemonode-6746cc987b-llp6l -c logdemonode -n onap bash
root@logdemonode-logdemonode-6746cc987b-llp6l:/usr/local/tomcat# printenv
TOMCAT_MAJOR=8
logDirRoot=/var
Michael O'Brien
jenkins sandbox - thanks Jessica Wagantall https://git.onap.org/ci-management/tree/Sandbox_Setup.md