Architecture
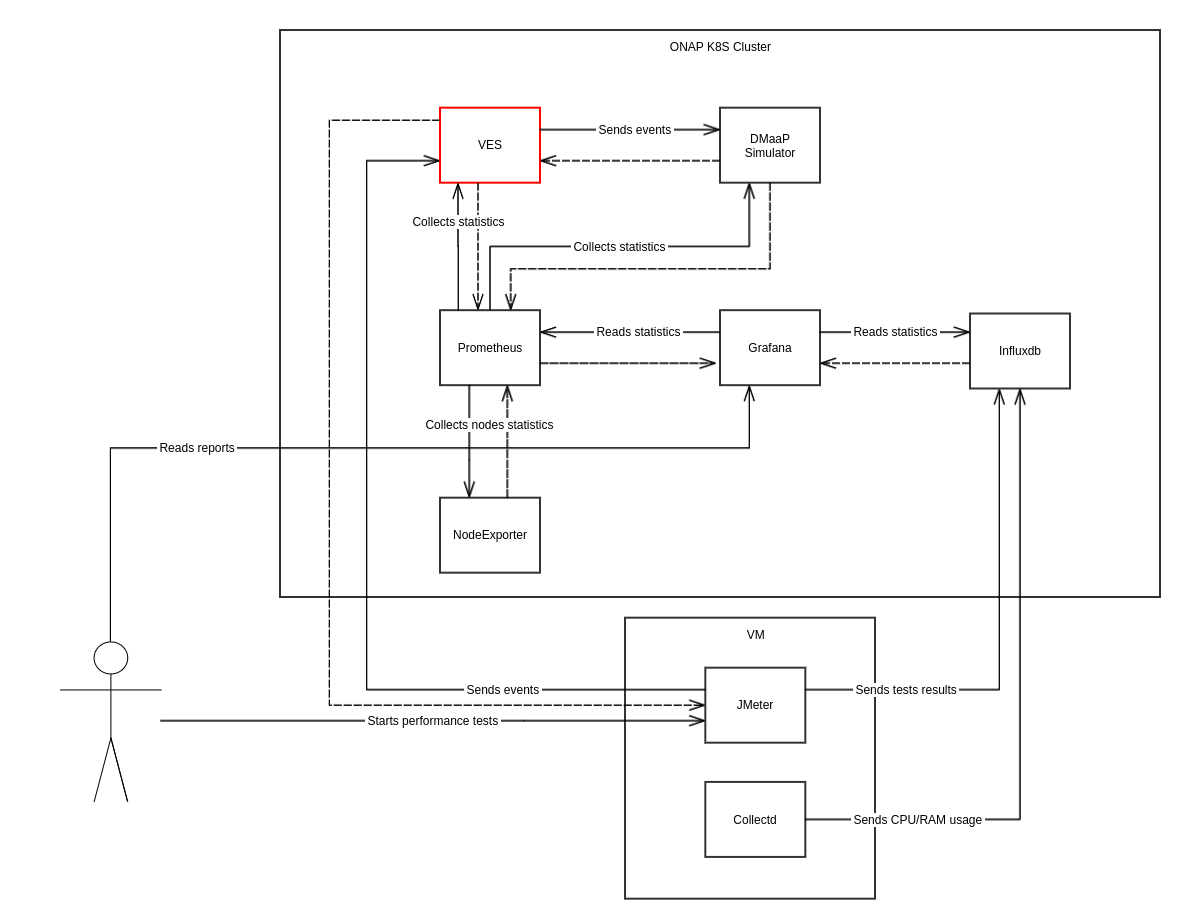
DMaaP Simulator
DMaap Simulator is a simple Spring Boot application, which exposes two endpoints. First endpoint (@PostMapping("/events/unauthenticated.SEC_FAULT_OUTPUT")) which receives fault events topic and second (@GetMapping("/summary")) which display events count and average processing time in milliseconds(depending on "startEpochMicrosec").
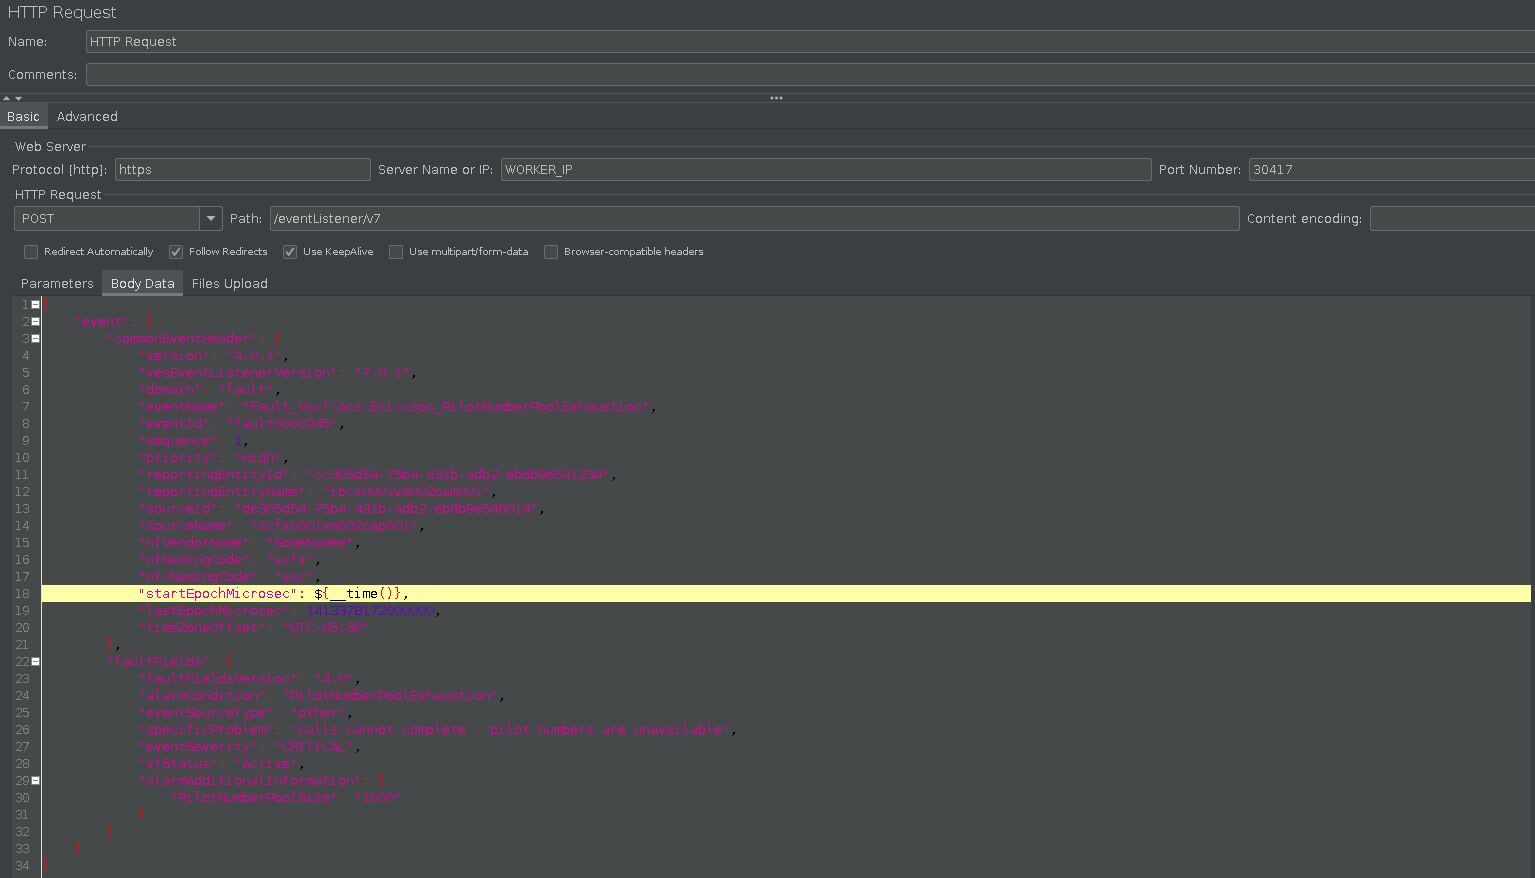
JMeter is generating the current epoch (current time) and updates this field:
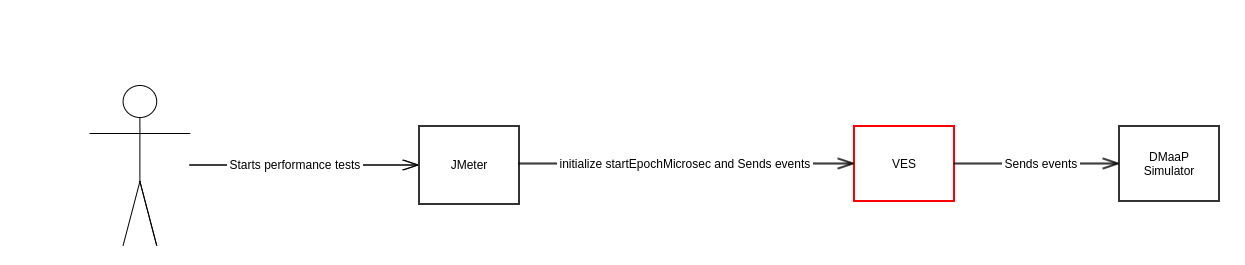
Architecture
DMaap Simulator image:

DMaap Simulator supports VES collector in the Frankfurt release.
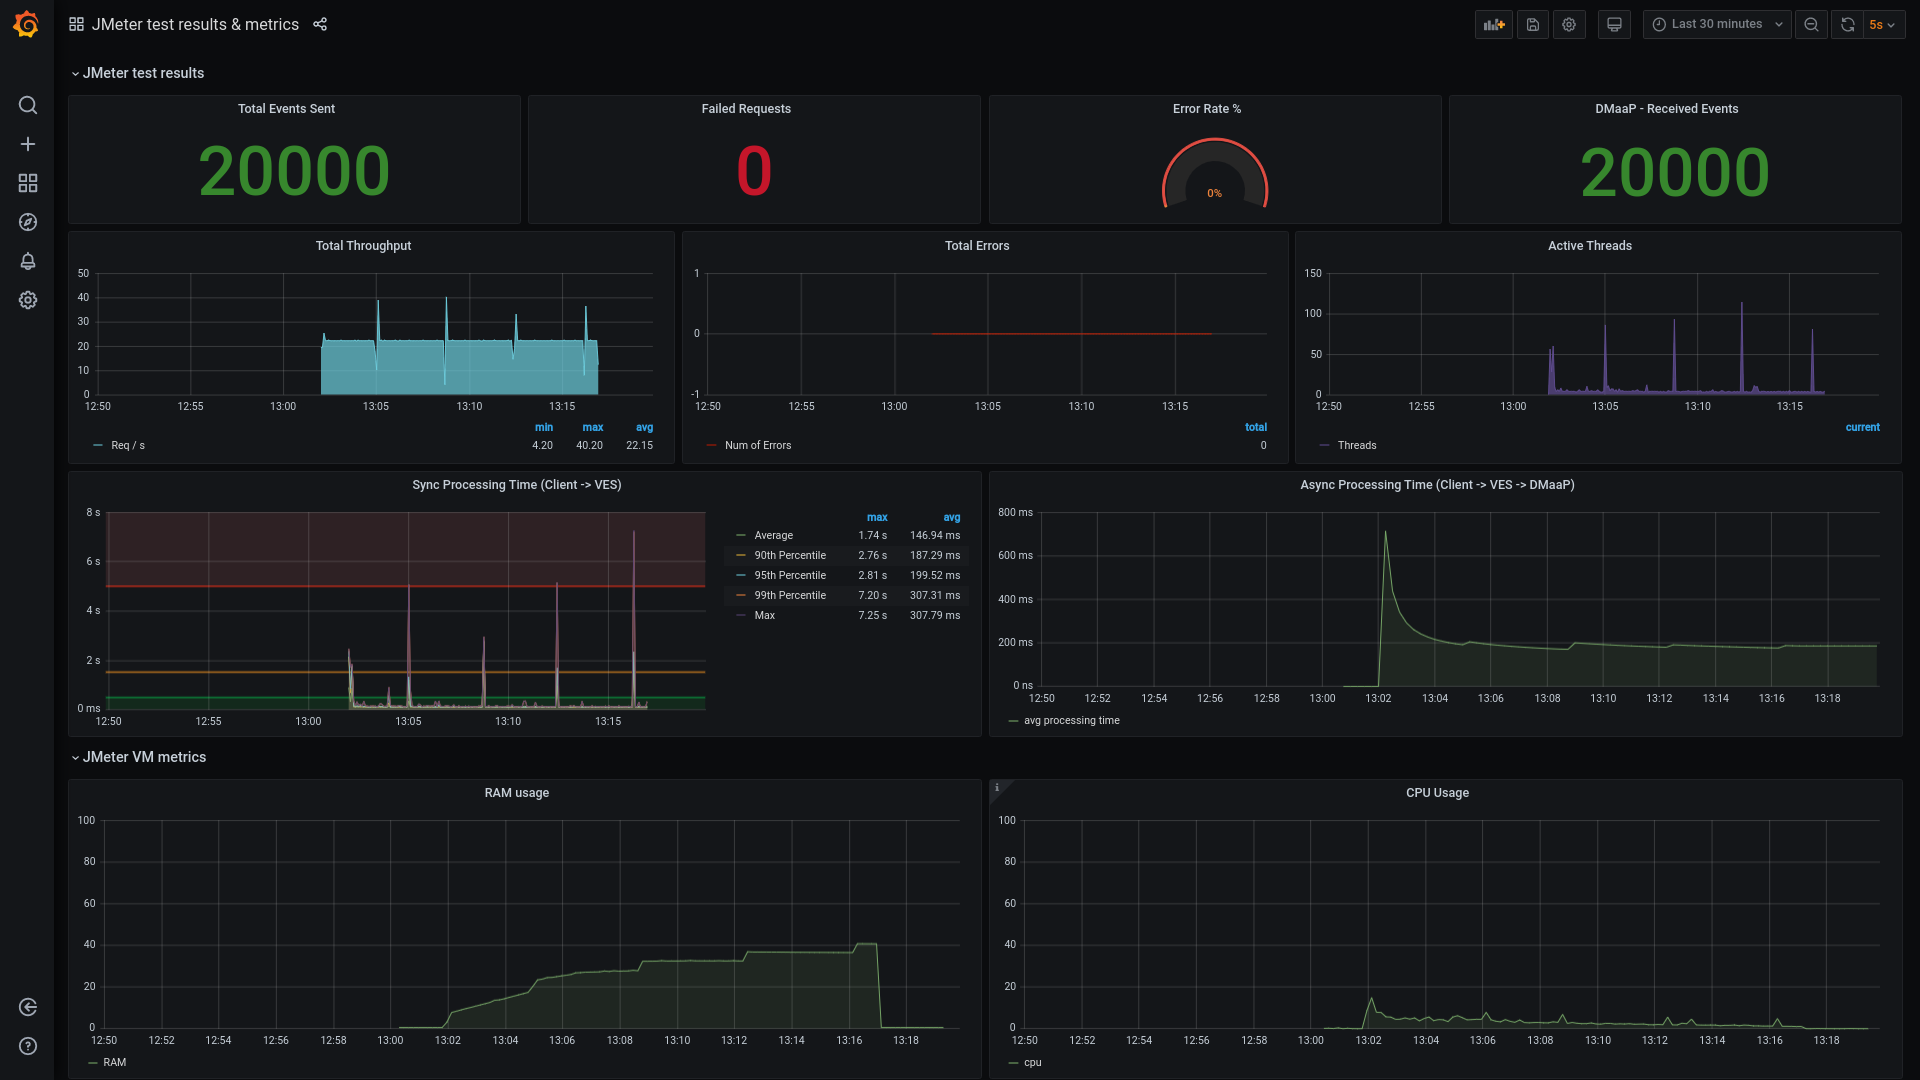
What is measured
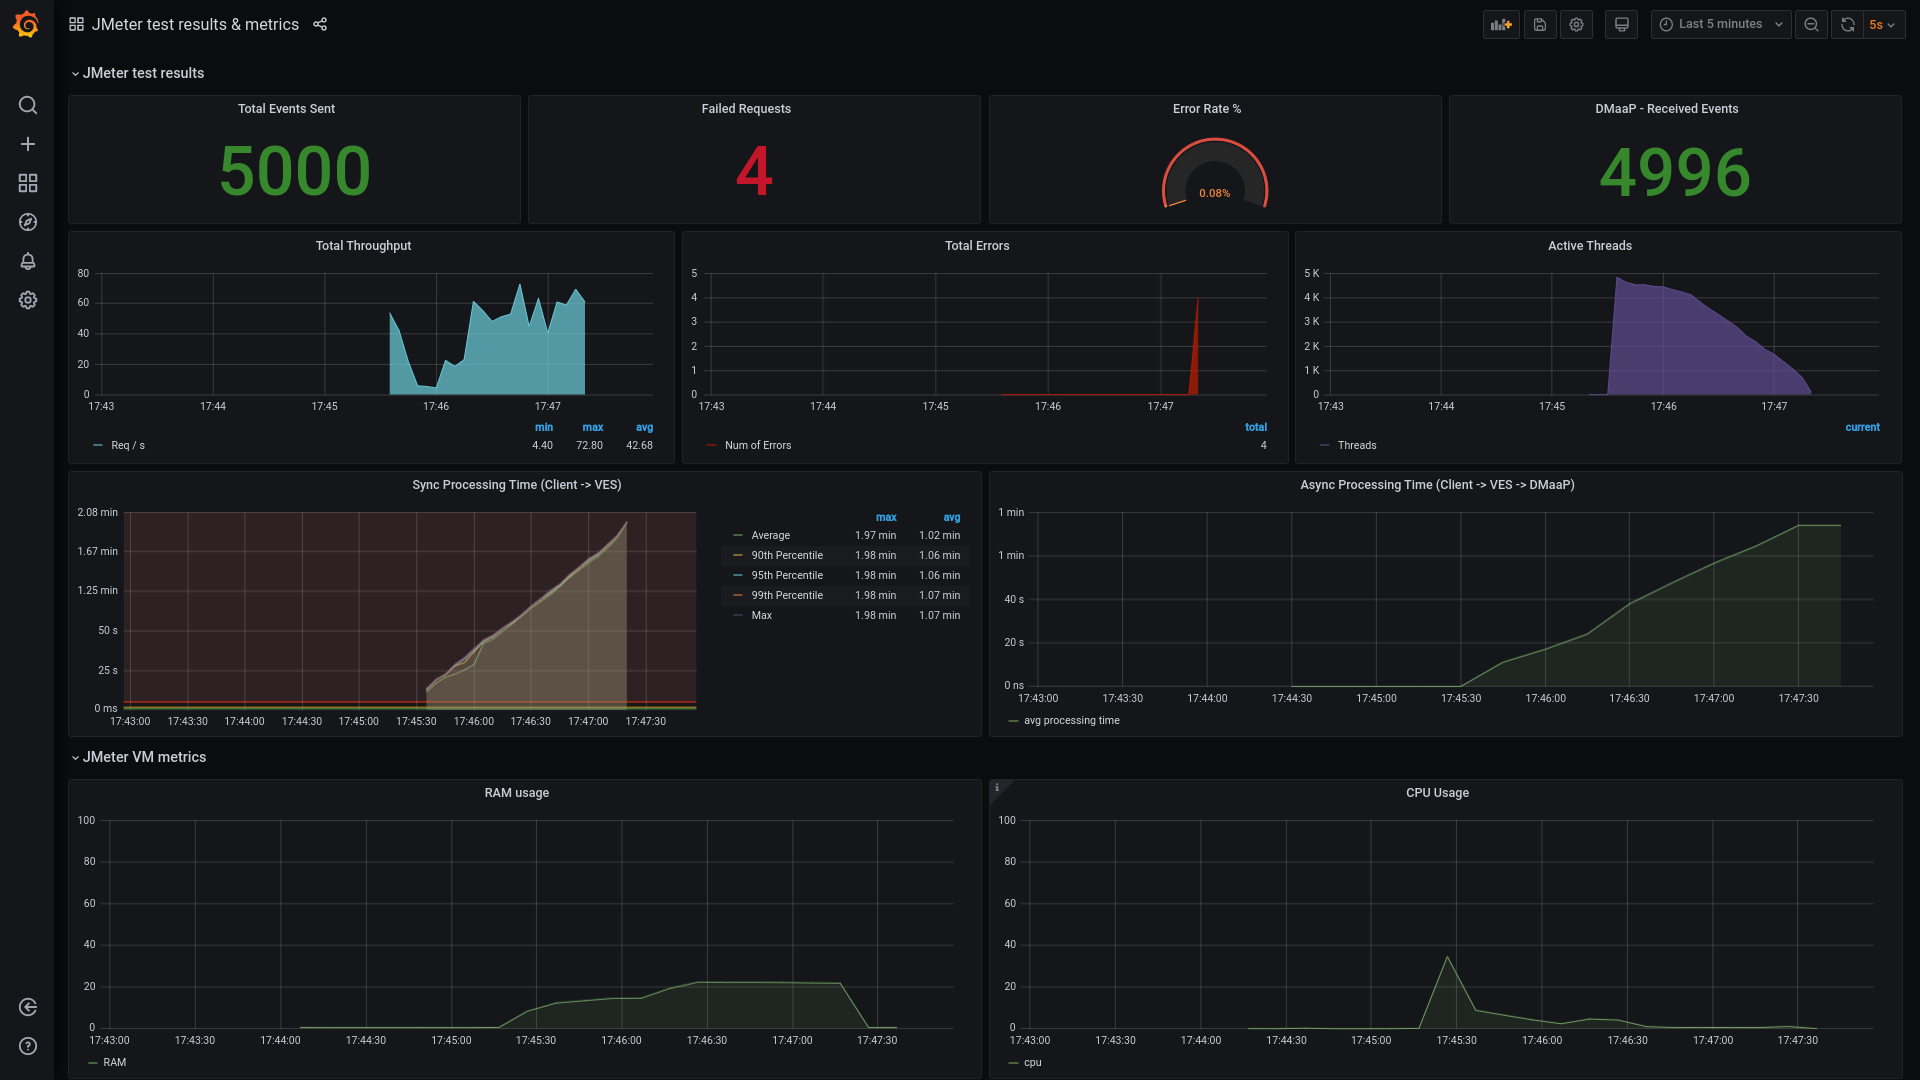
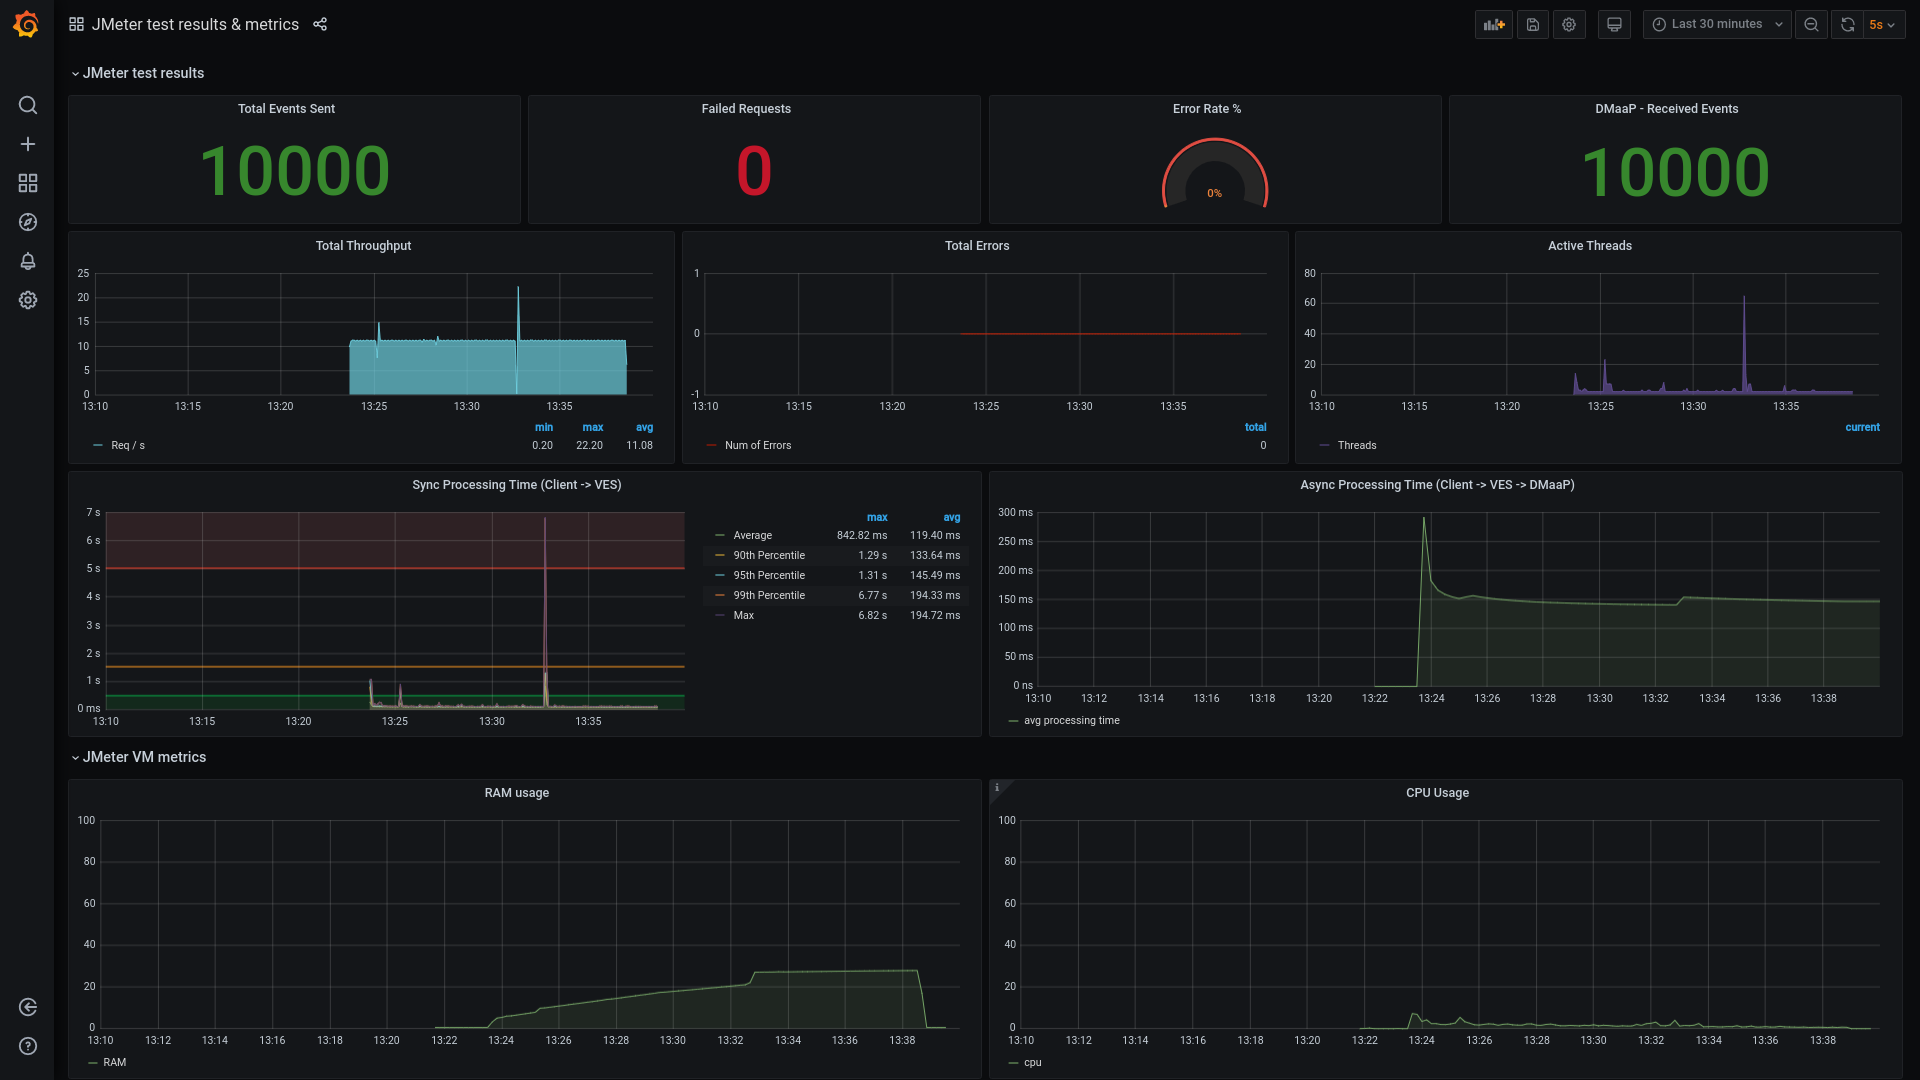
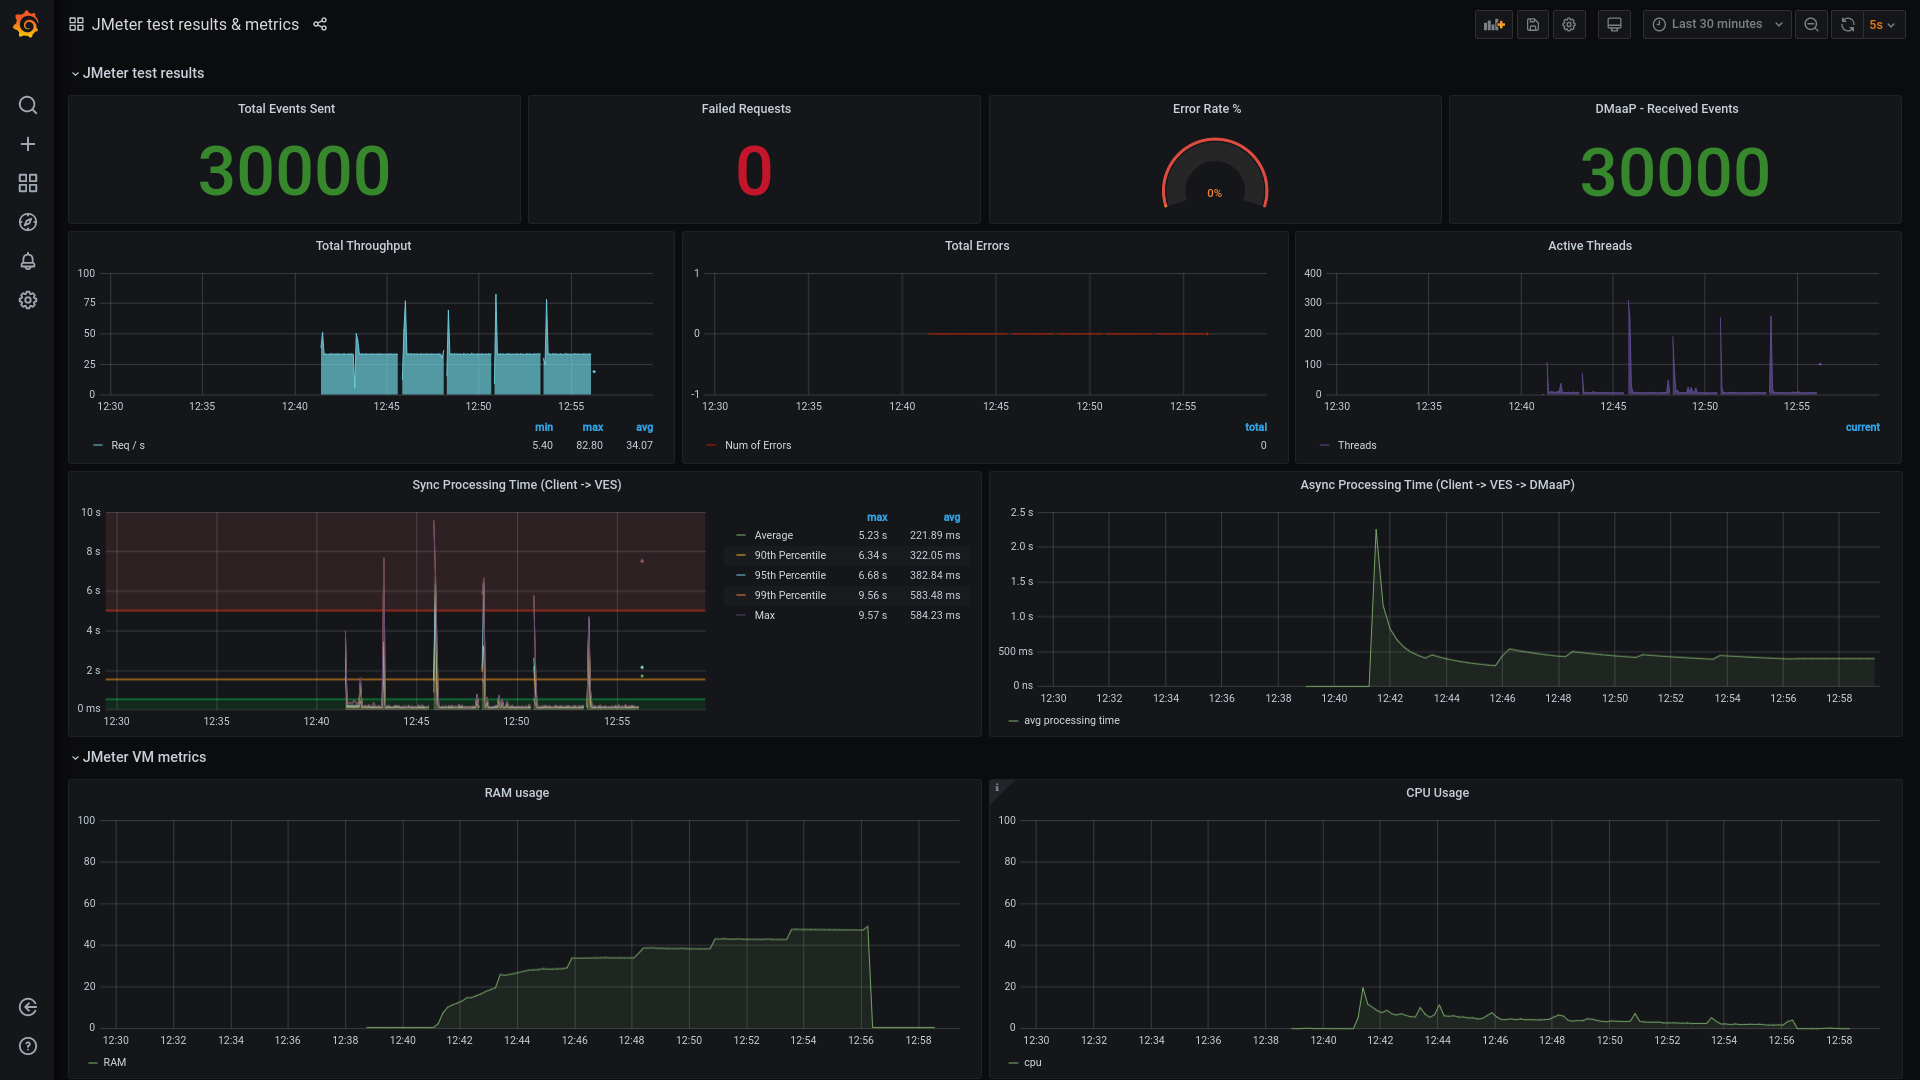
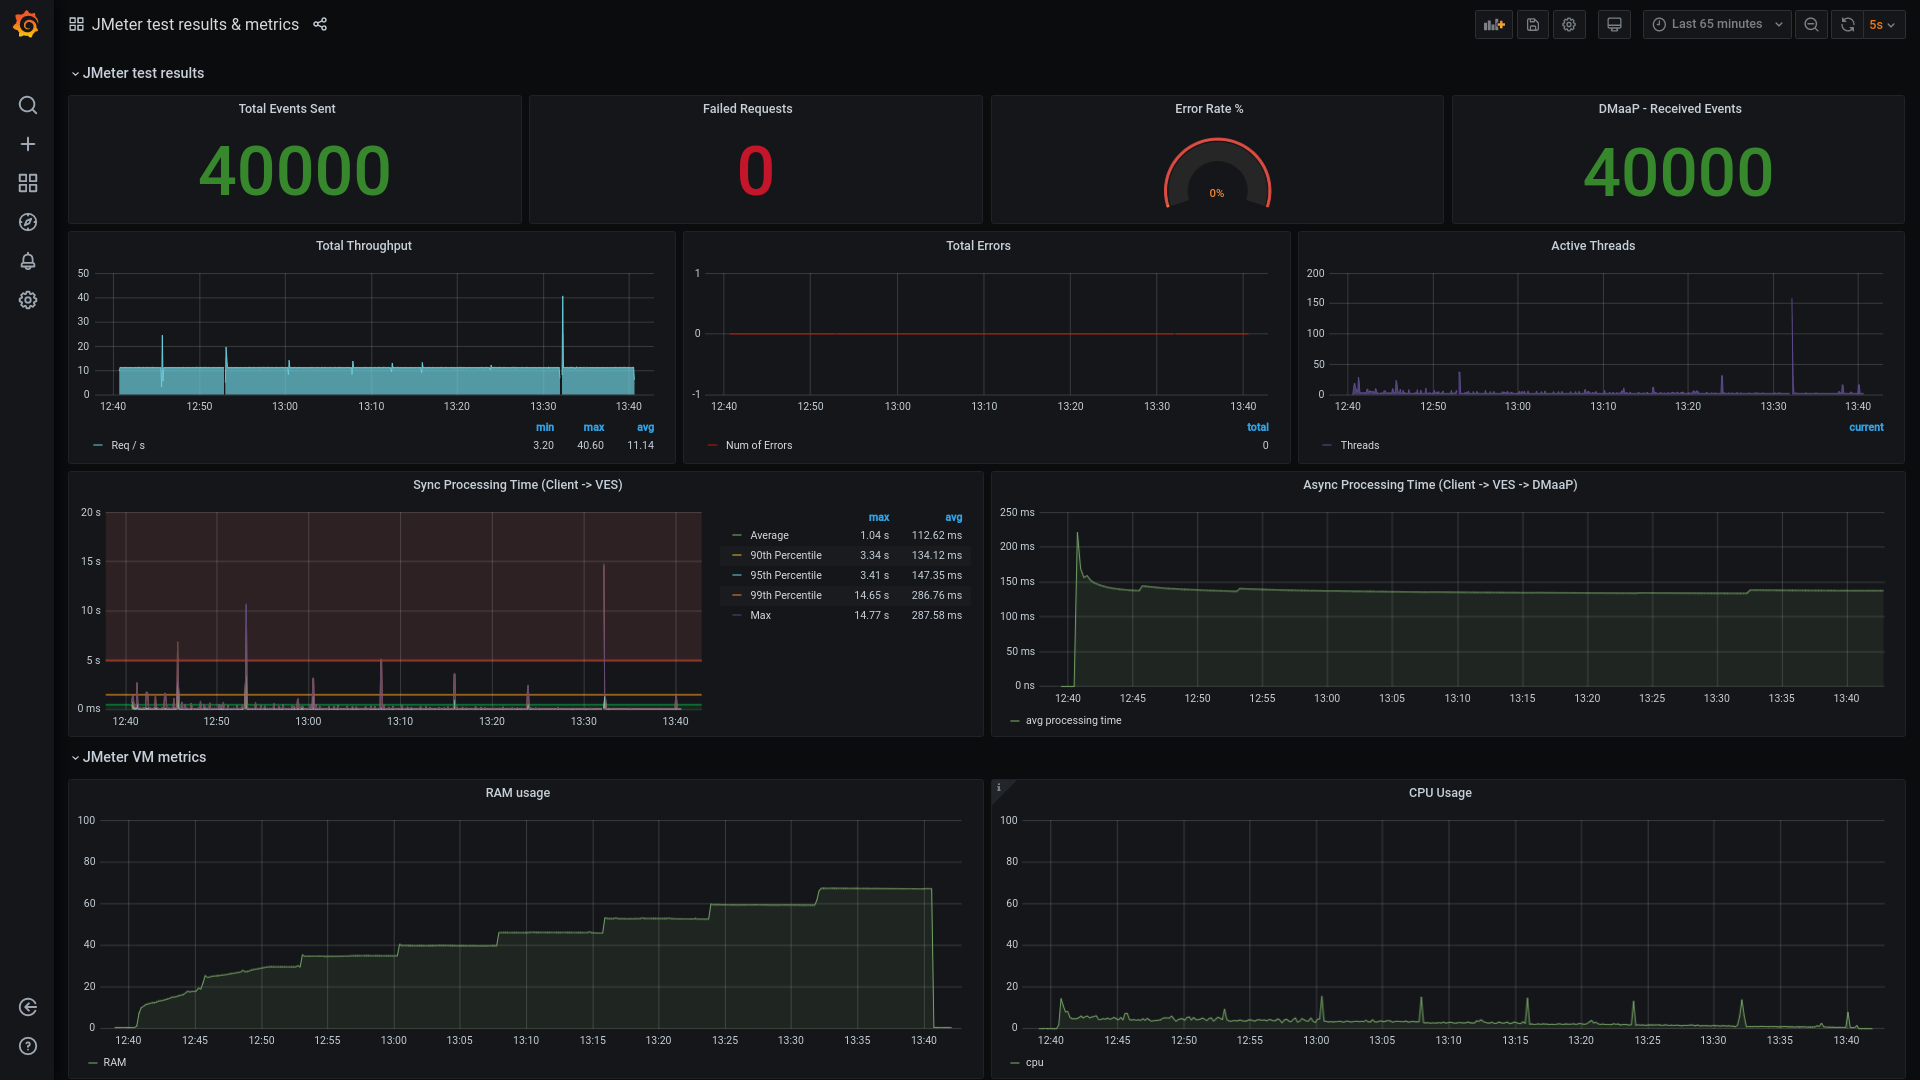
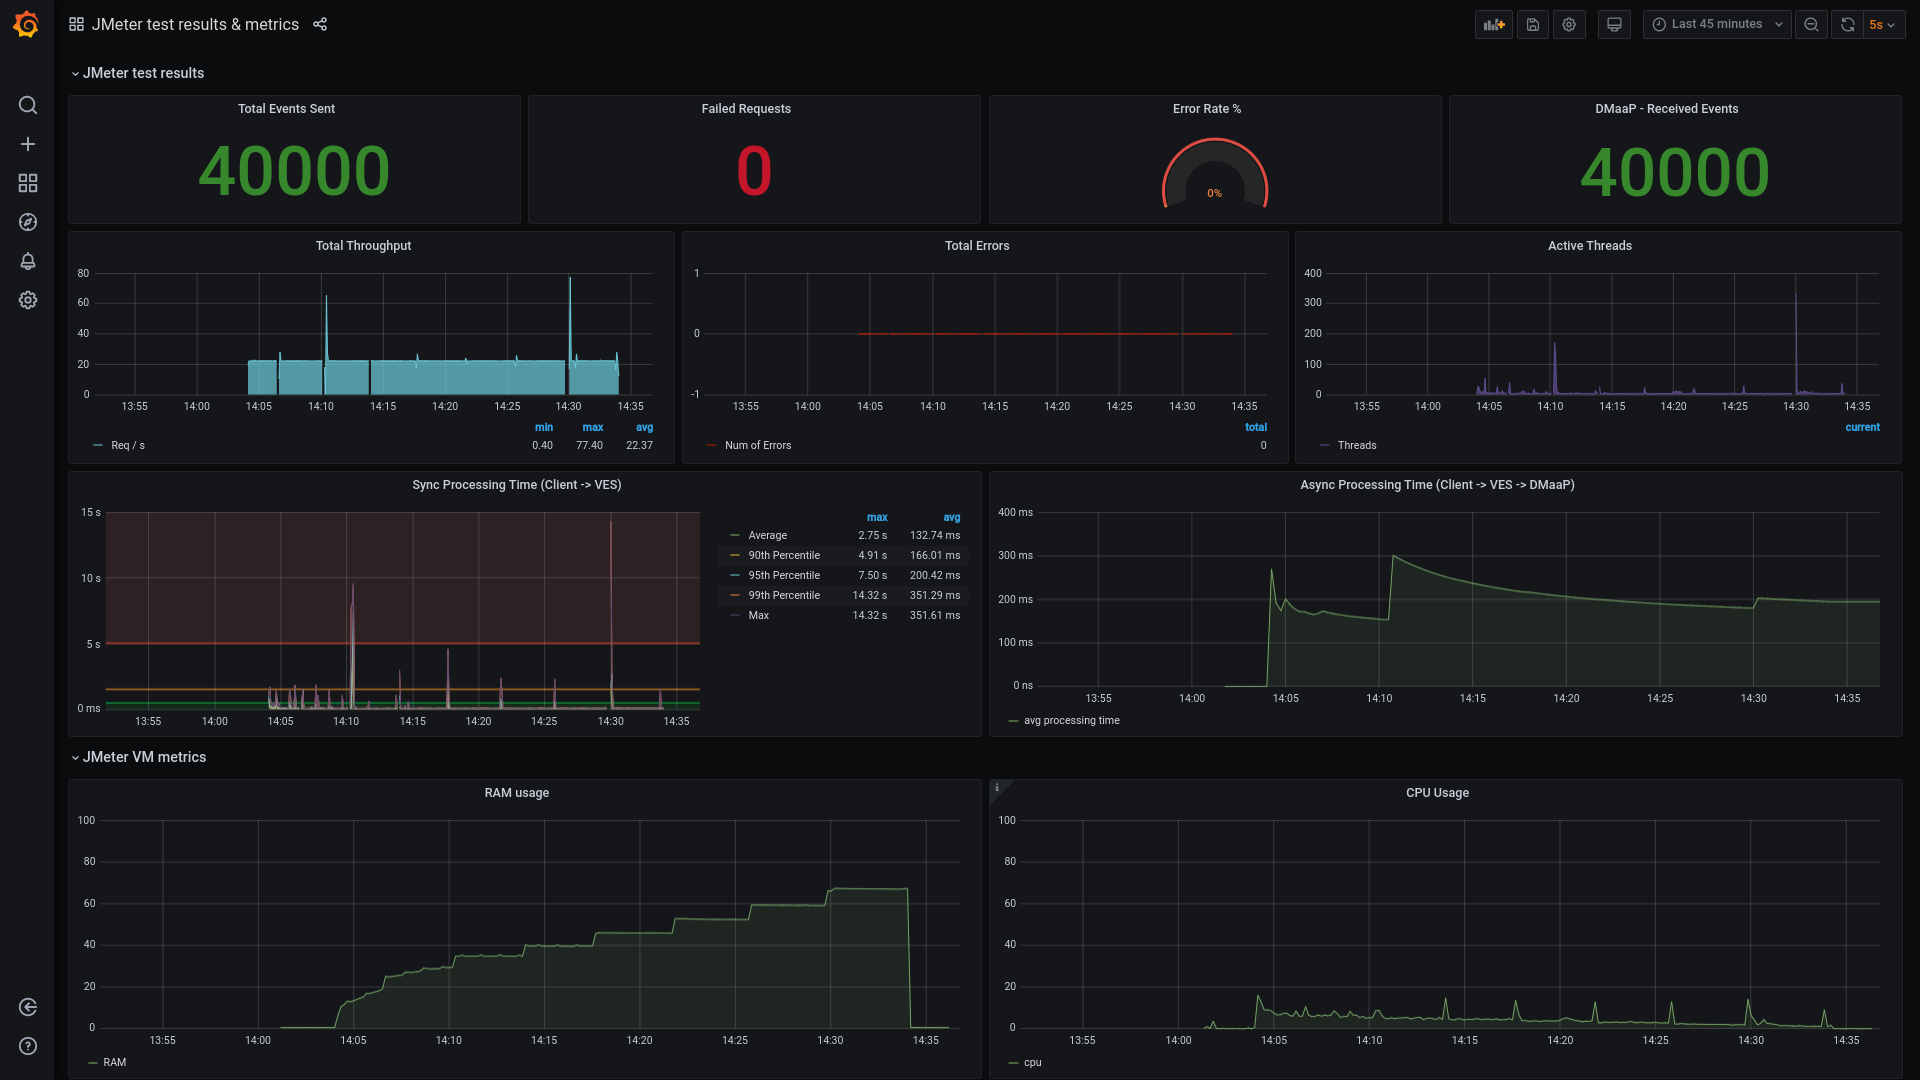
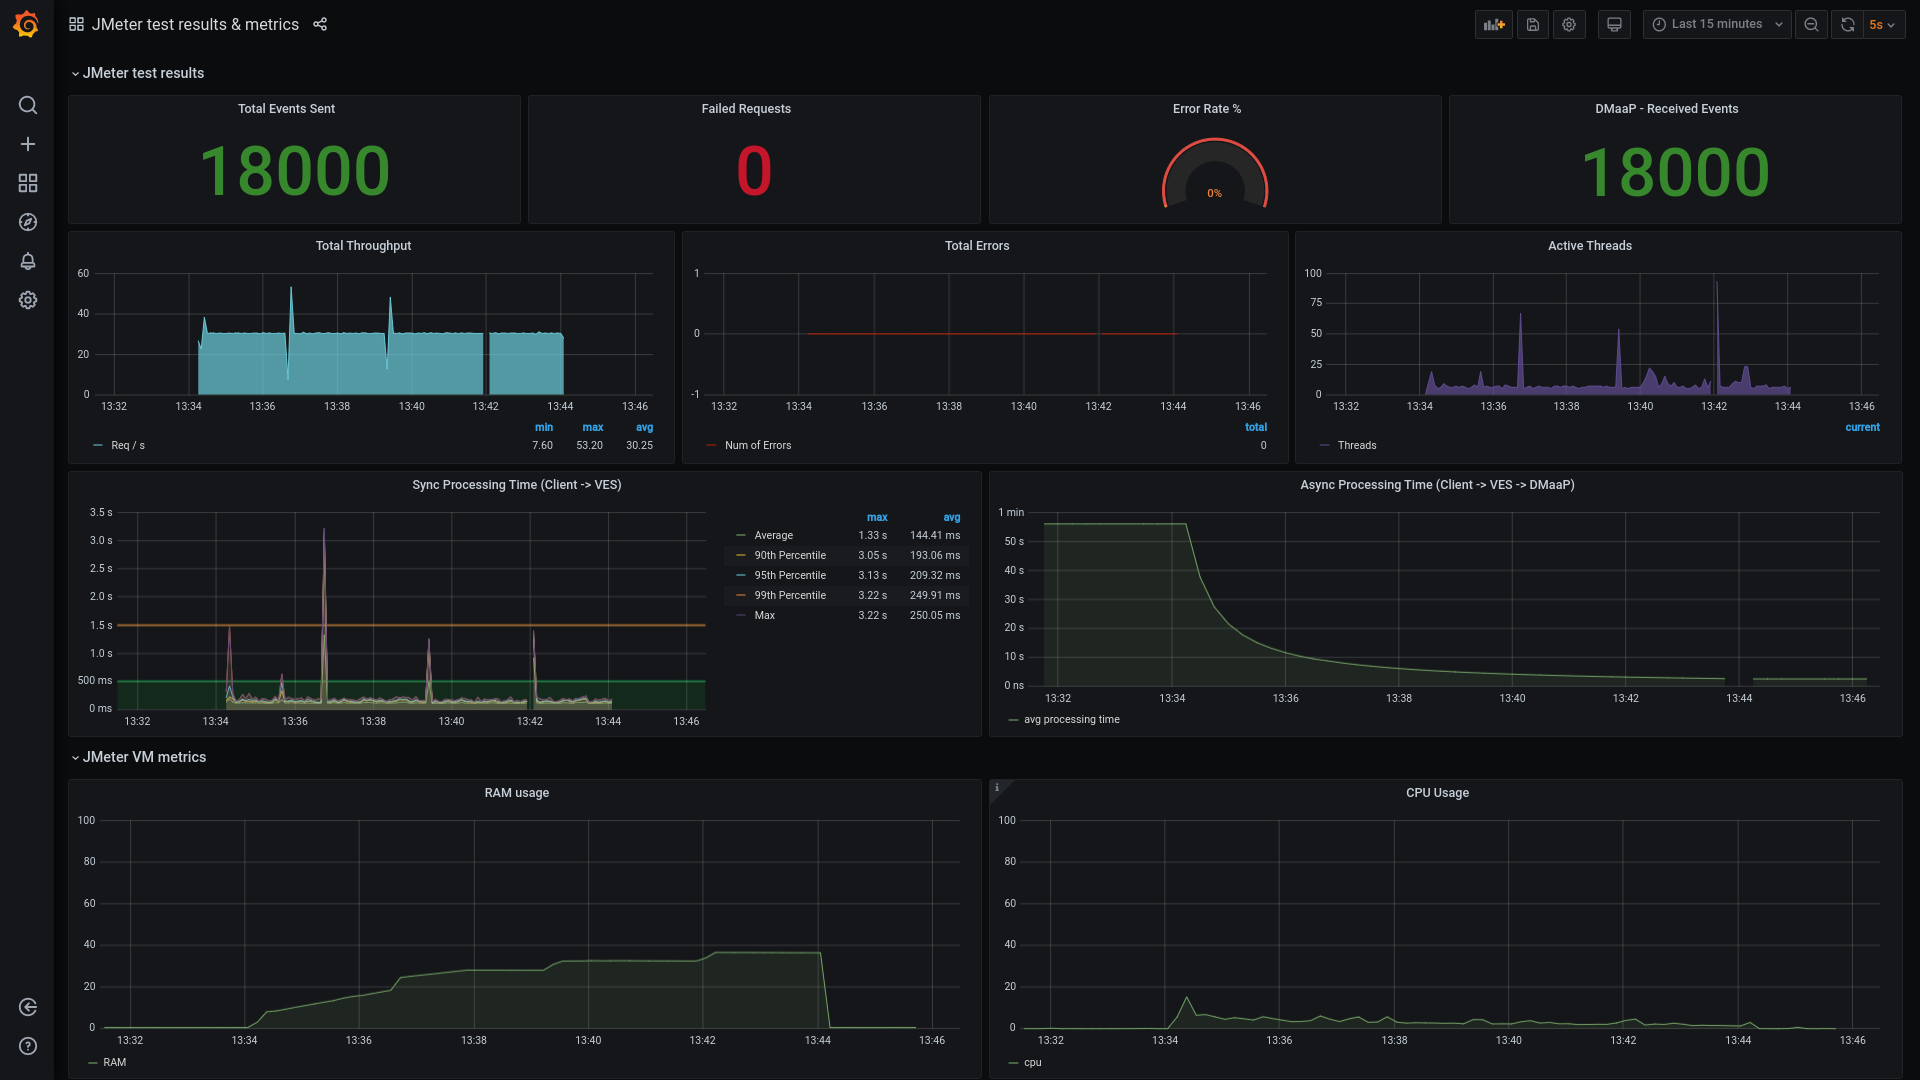
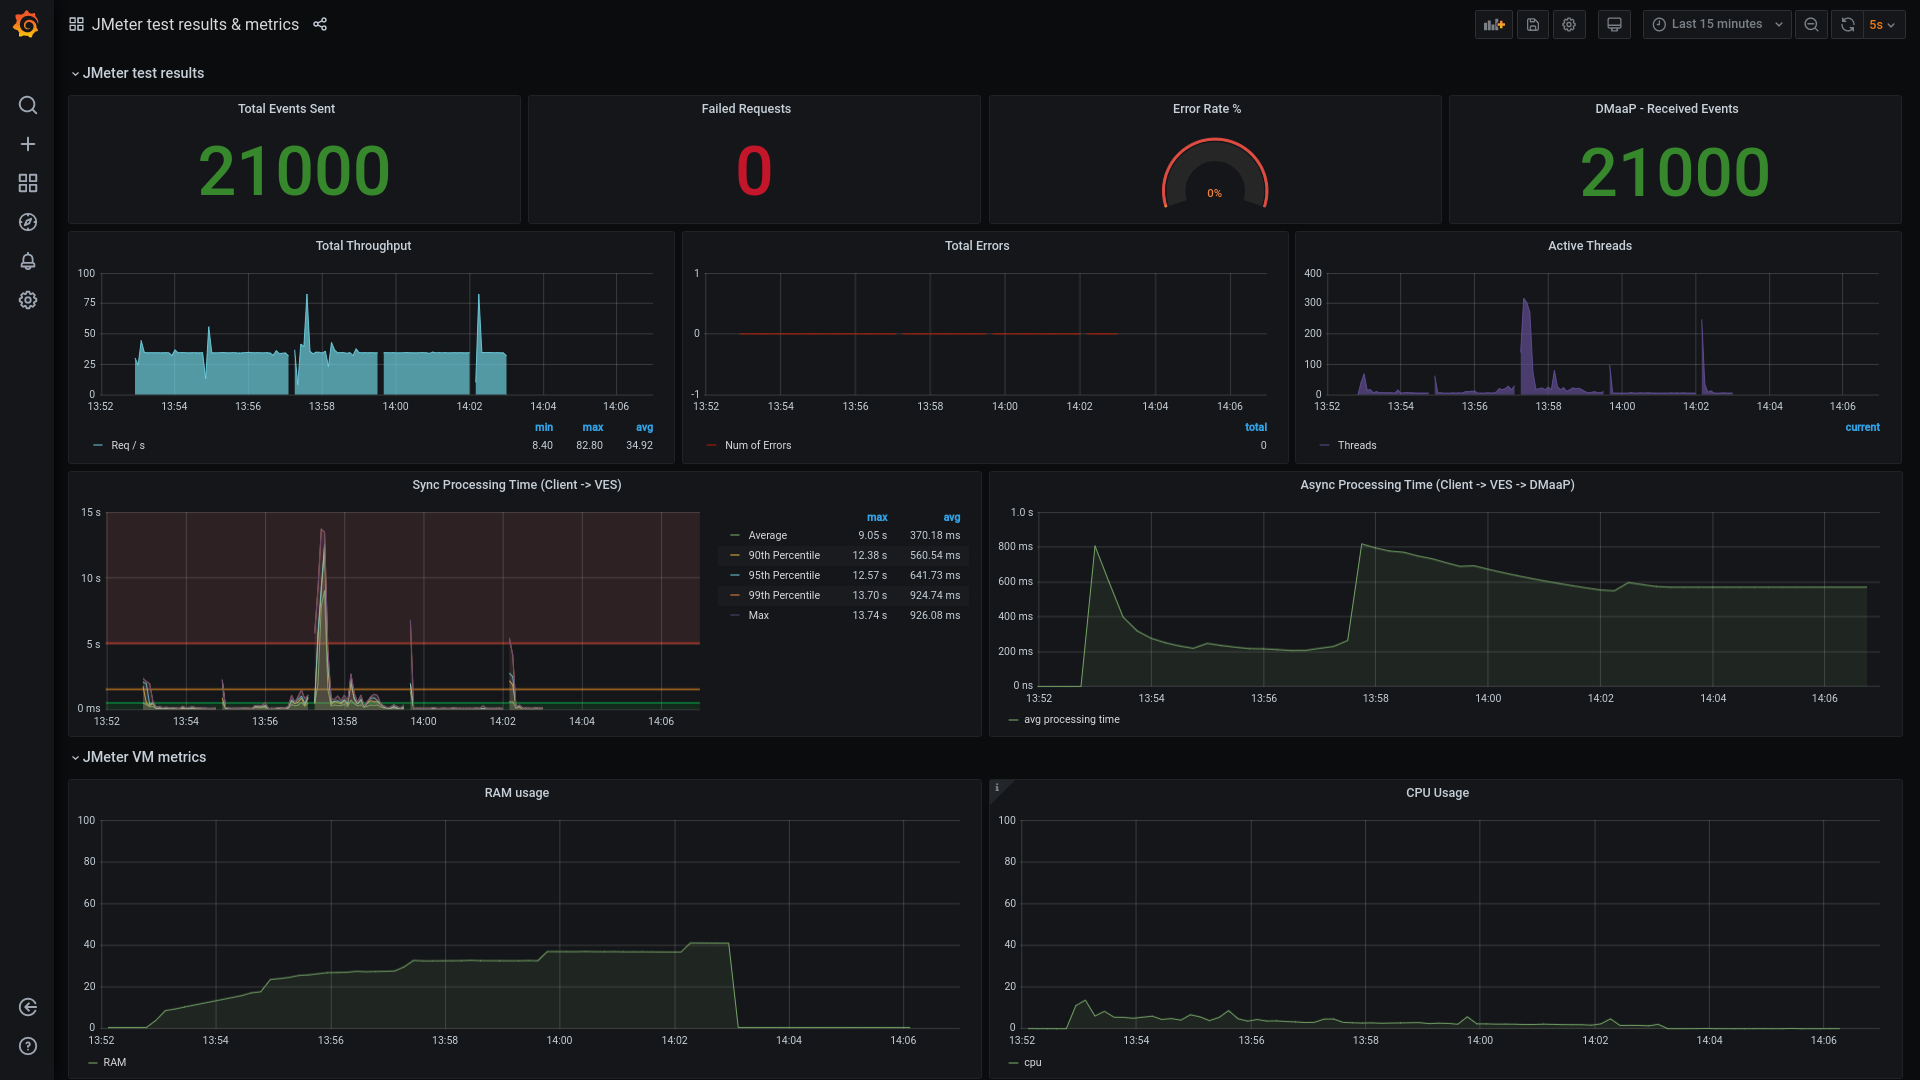
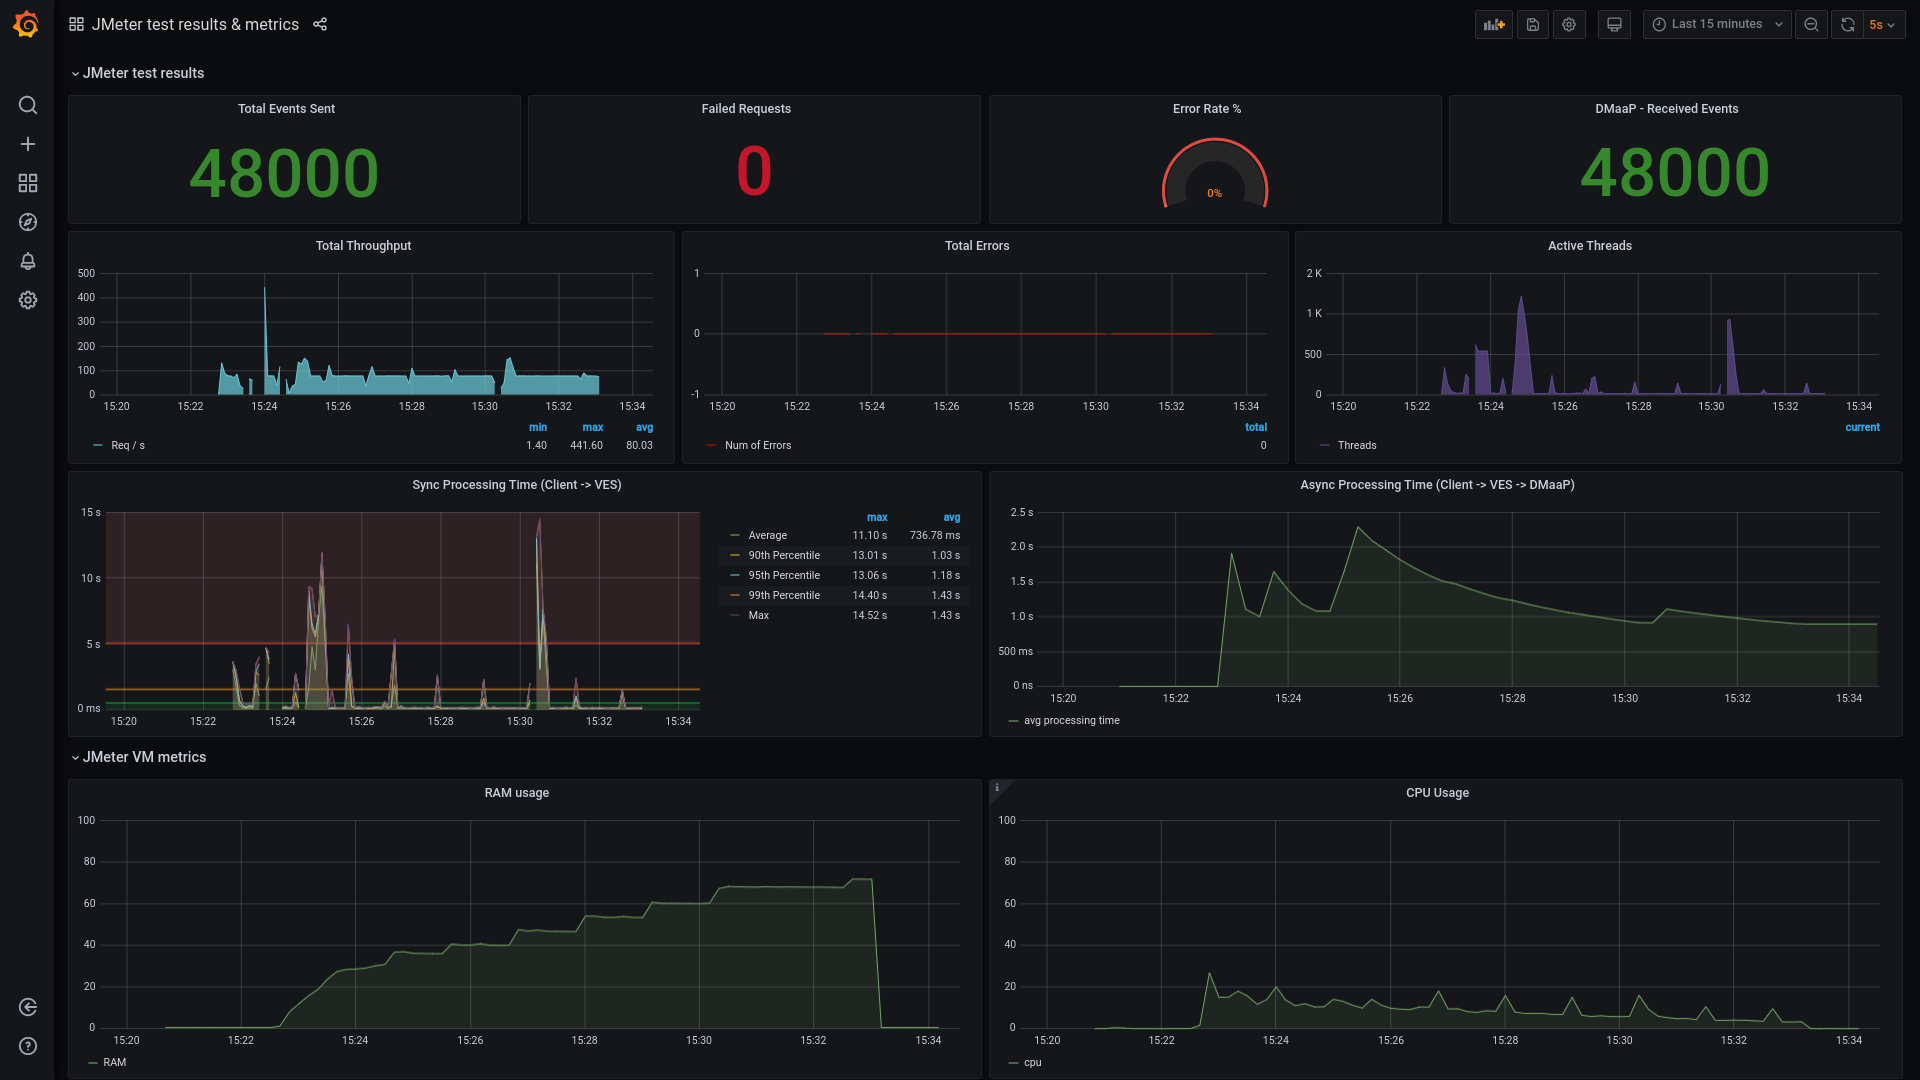
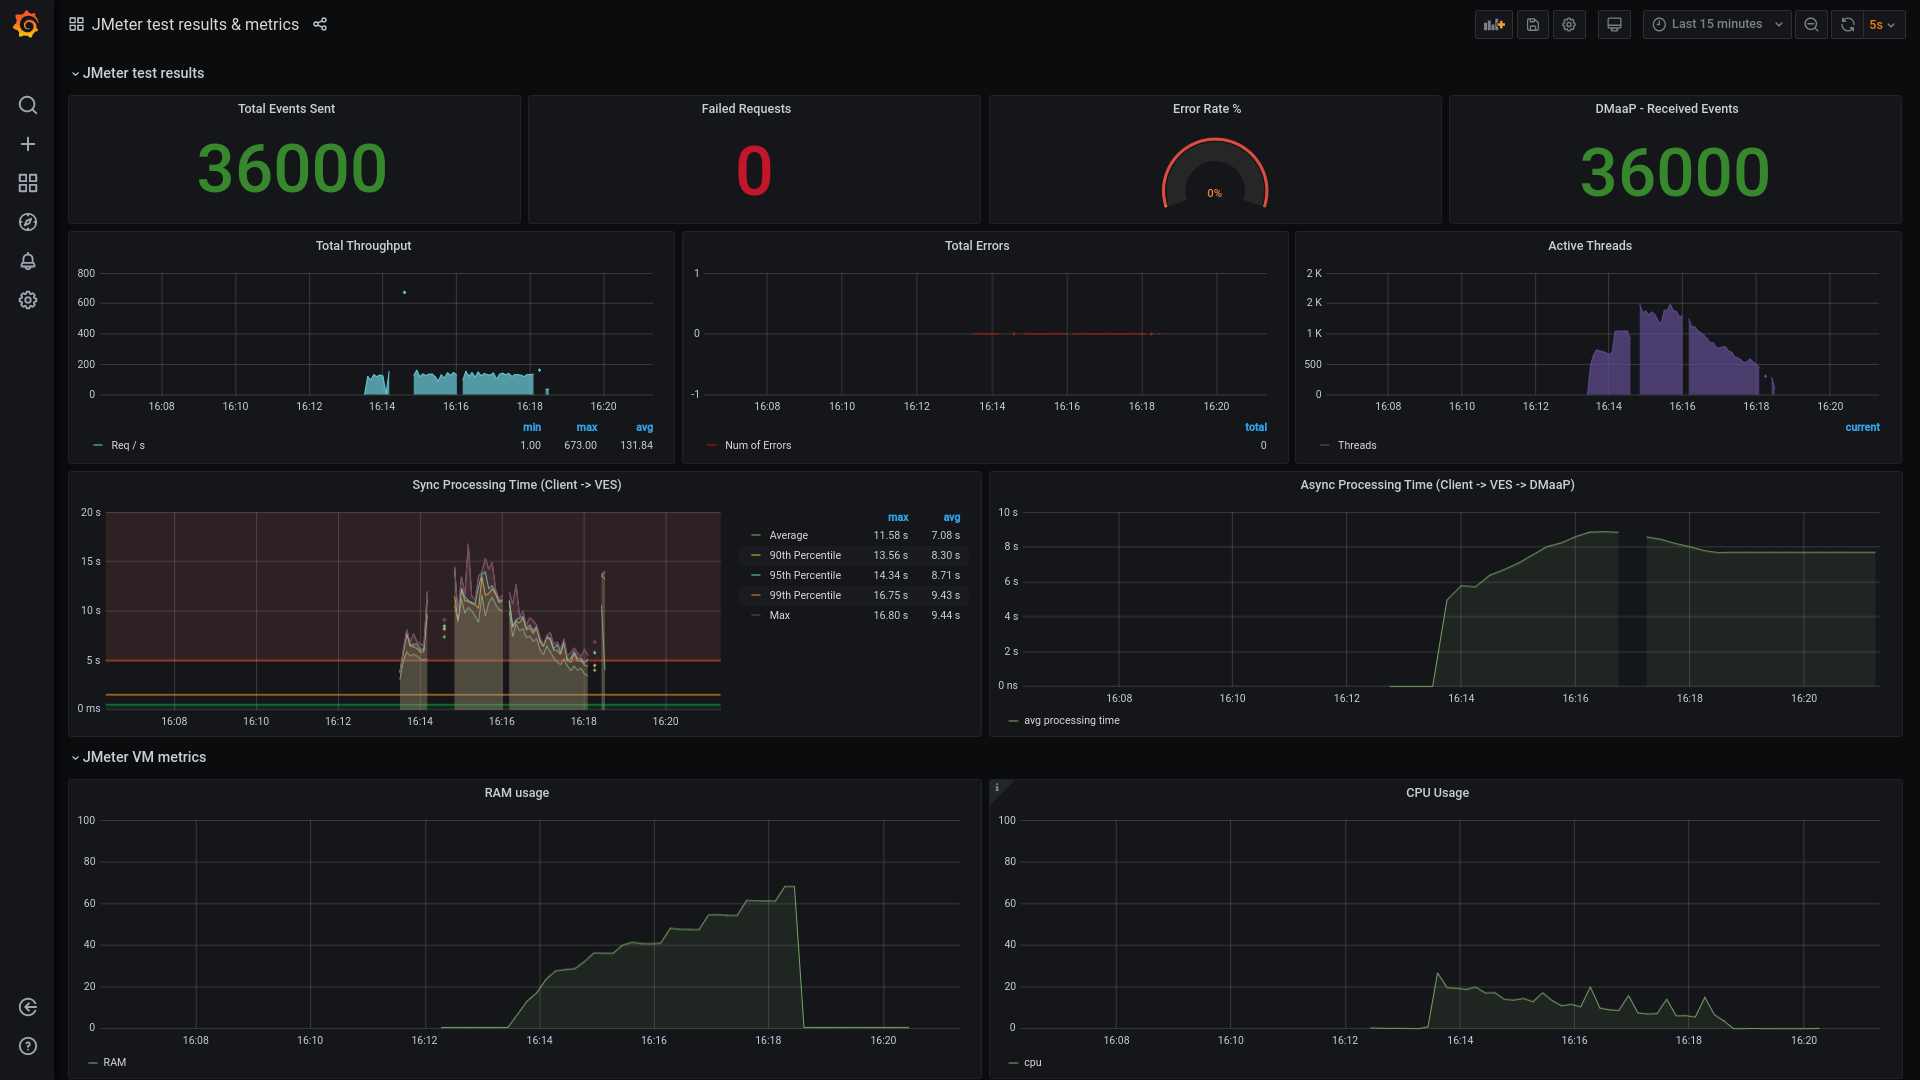
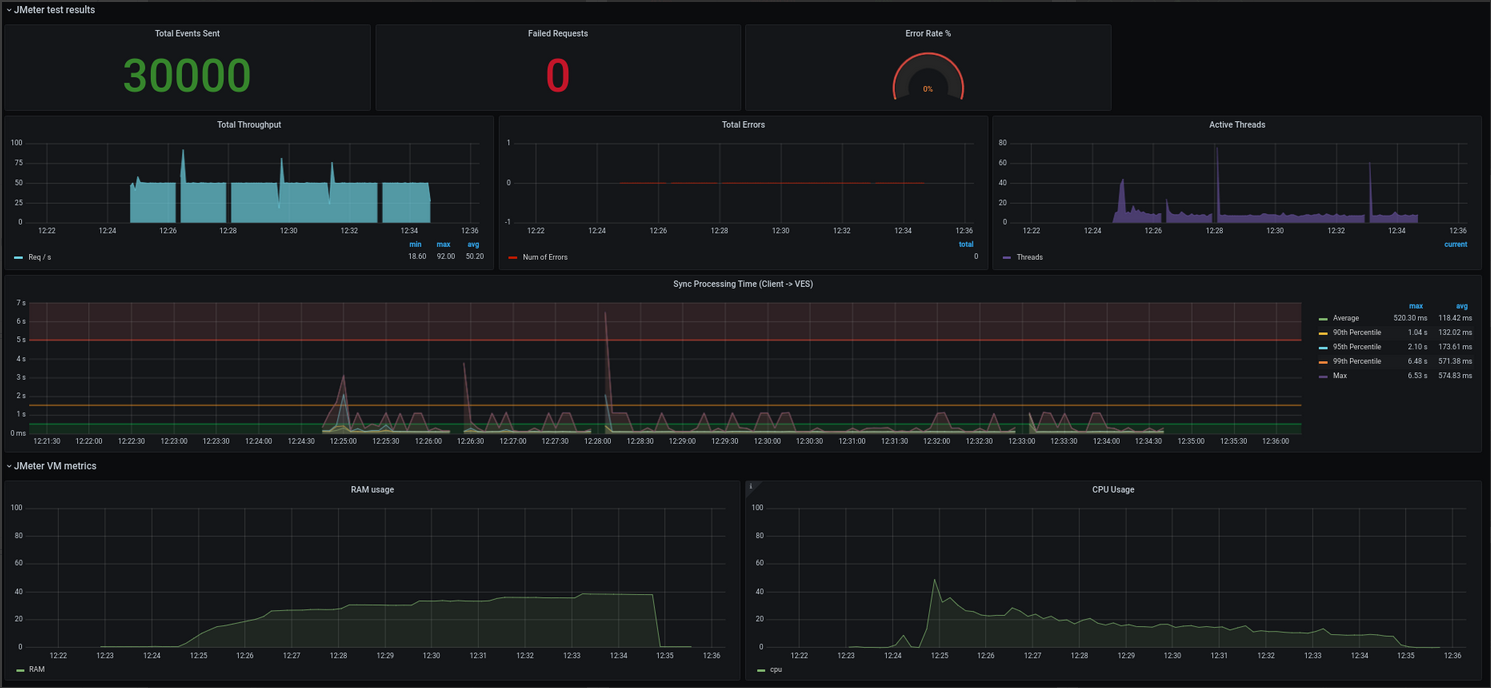
JMeter test results & metrics
- Total Events Sent - total number of events sent by JMeter (including failed requests)
- Failed Requests - total number of failed requests
- Error Rate % - 'Failed Requests' to 'Total Events Sent' ratio in percentages
- DMaaP - Received Events - total number of events received by DMaaP on Fault topic
- Total Throughput - number of events sent per second by JMeter
- Total Errors - failed requests per second
- Active Threads - number of active threads per second
- Sync Processing Time (Client → VES) - time measured from sending the request by JMeter to receiving the response by JMeter
- Async Processing Time (Client → VES → DMaaP) - time measured from sending the request by JMeter to receiving the event by DMaaP
- RAM Usage - RAM usage of JMeter VM
- CPU Usage - CPU usage of JMeter VM
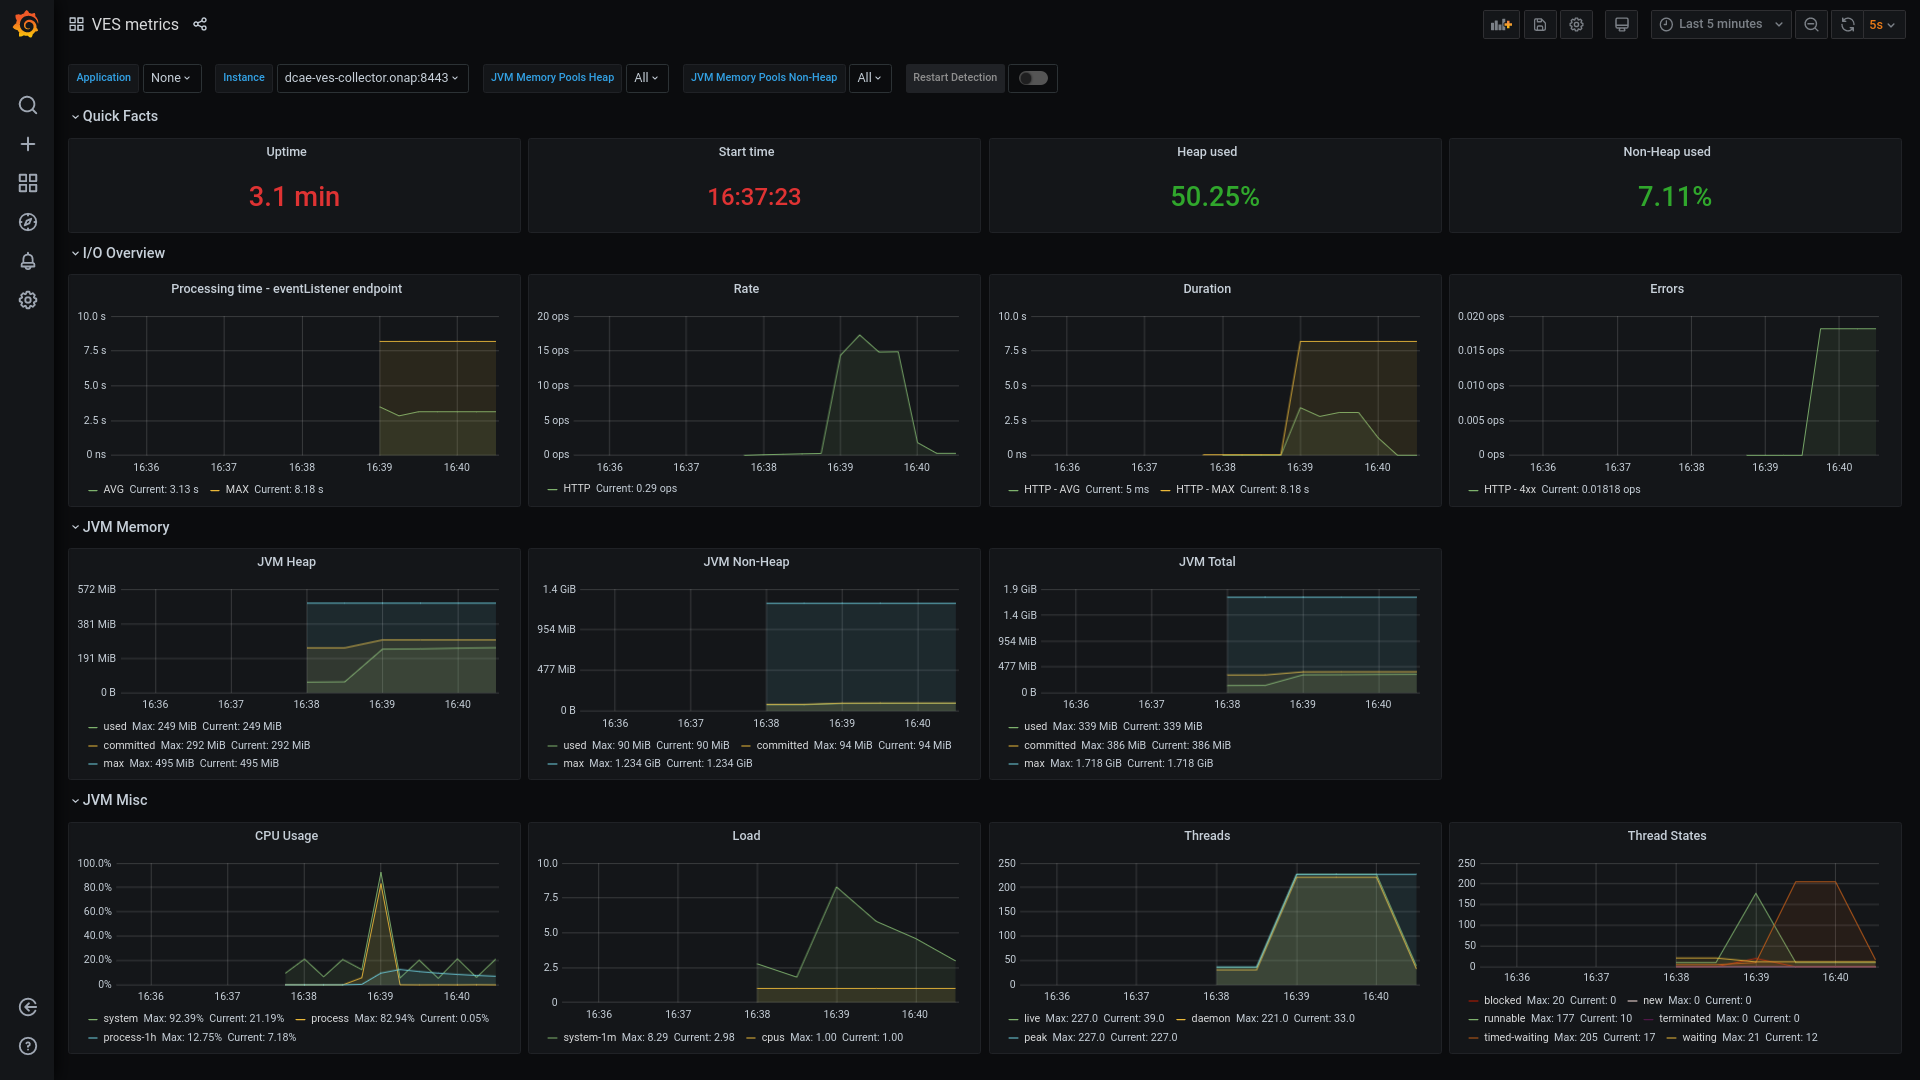
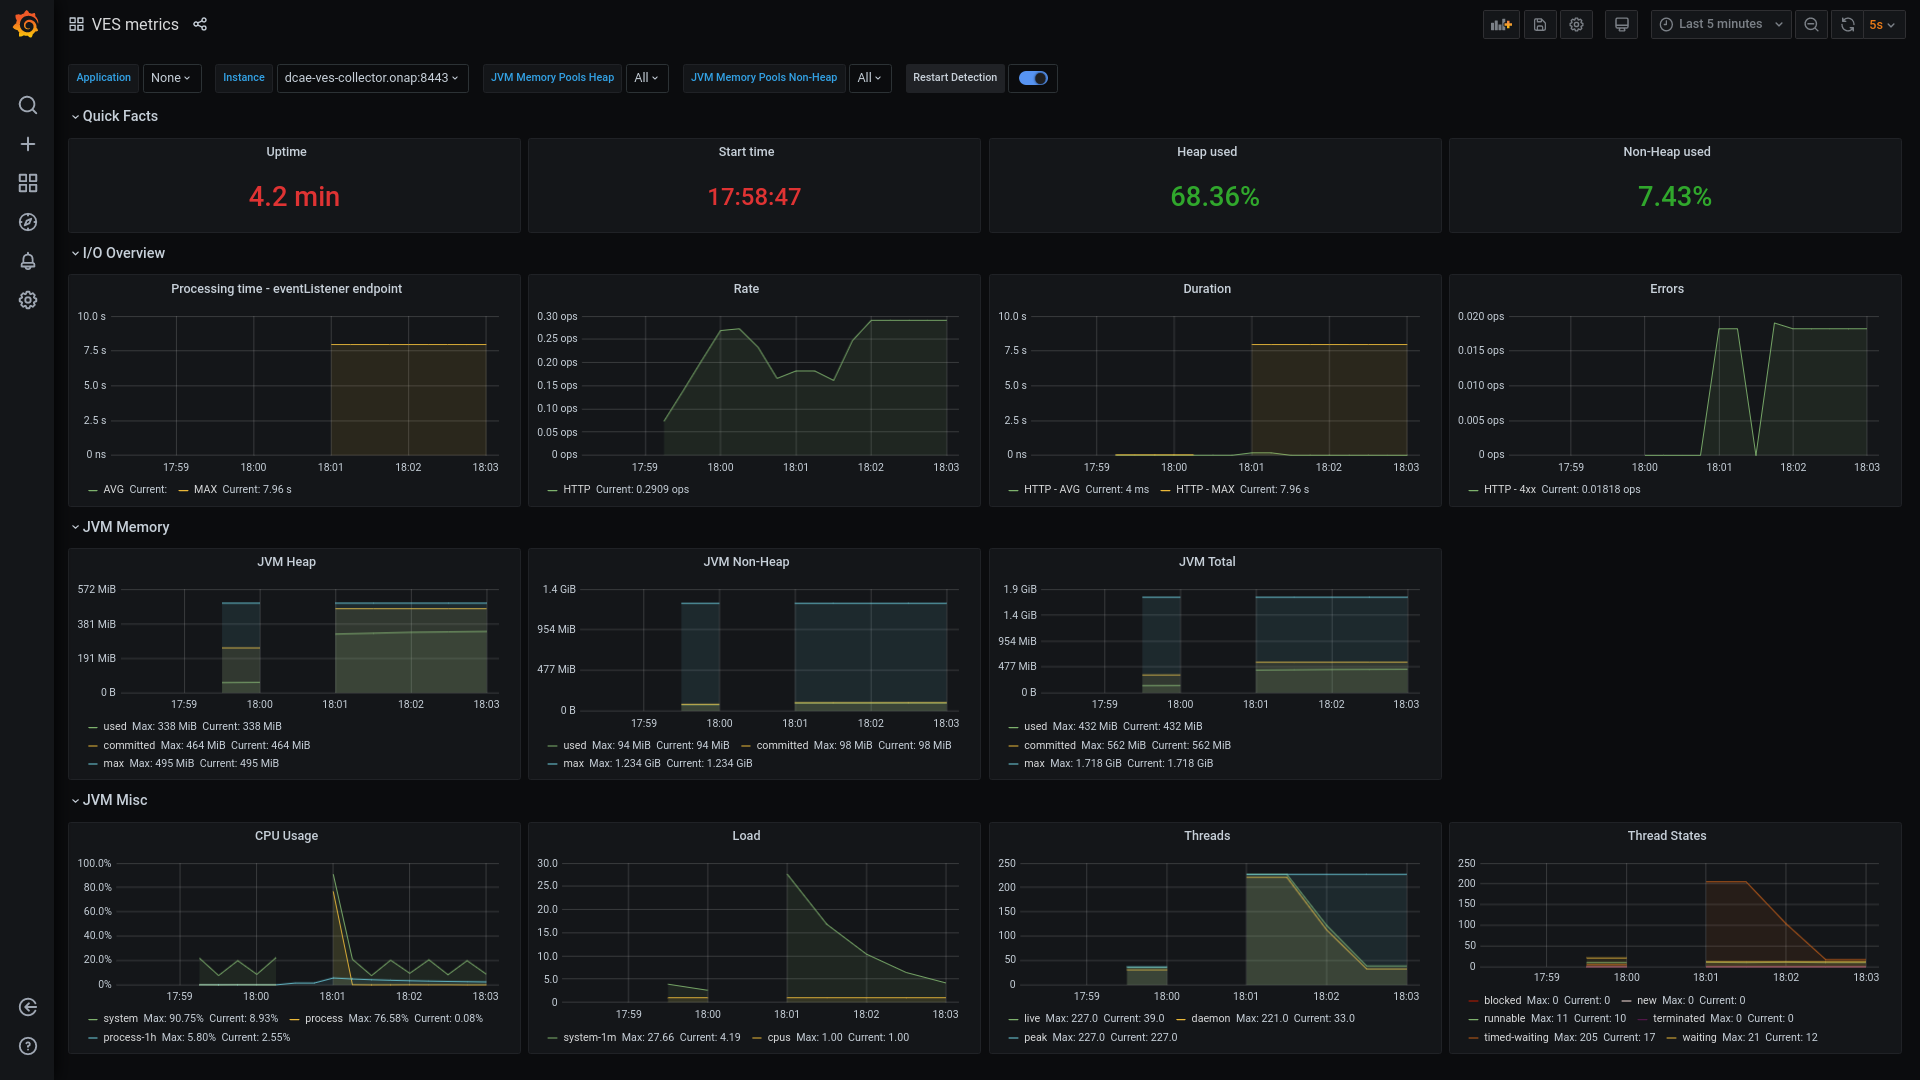
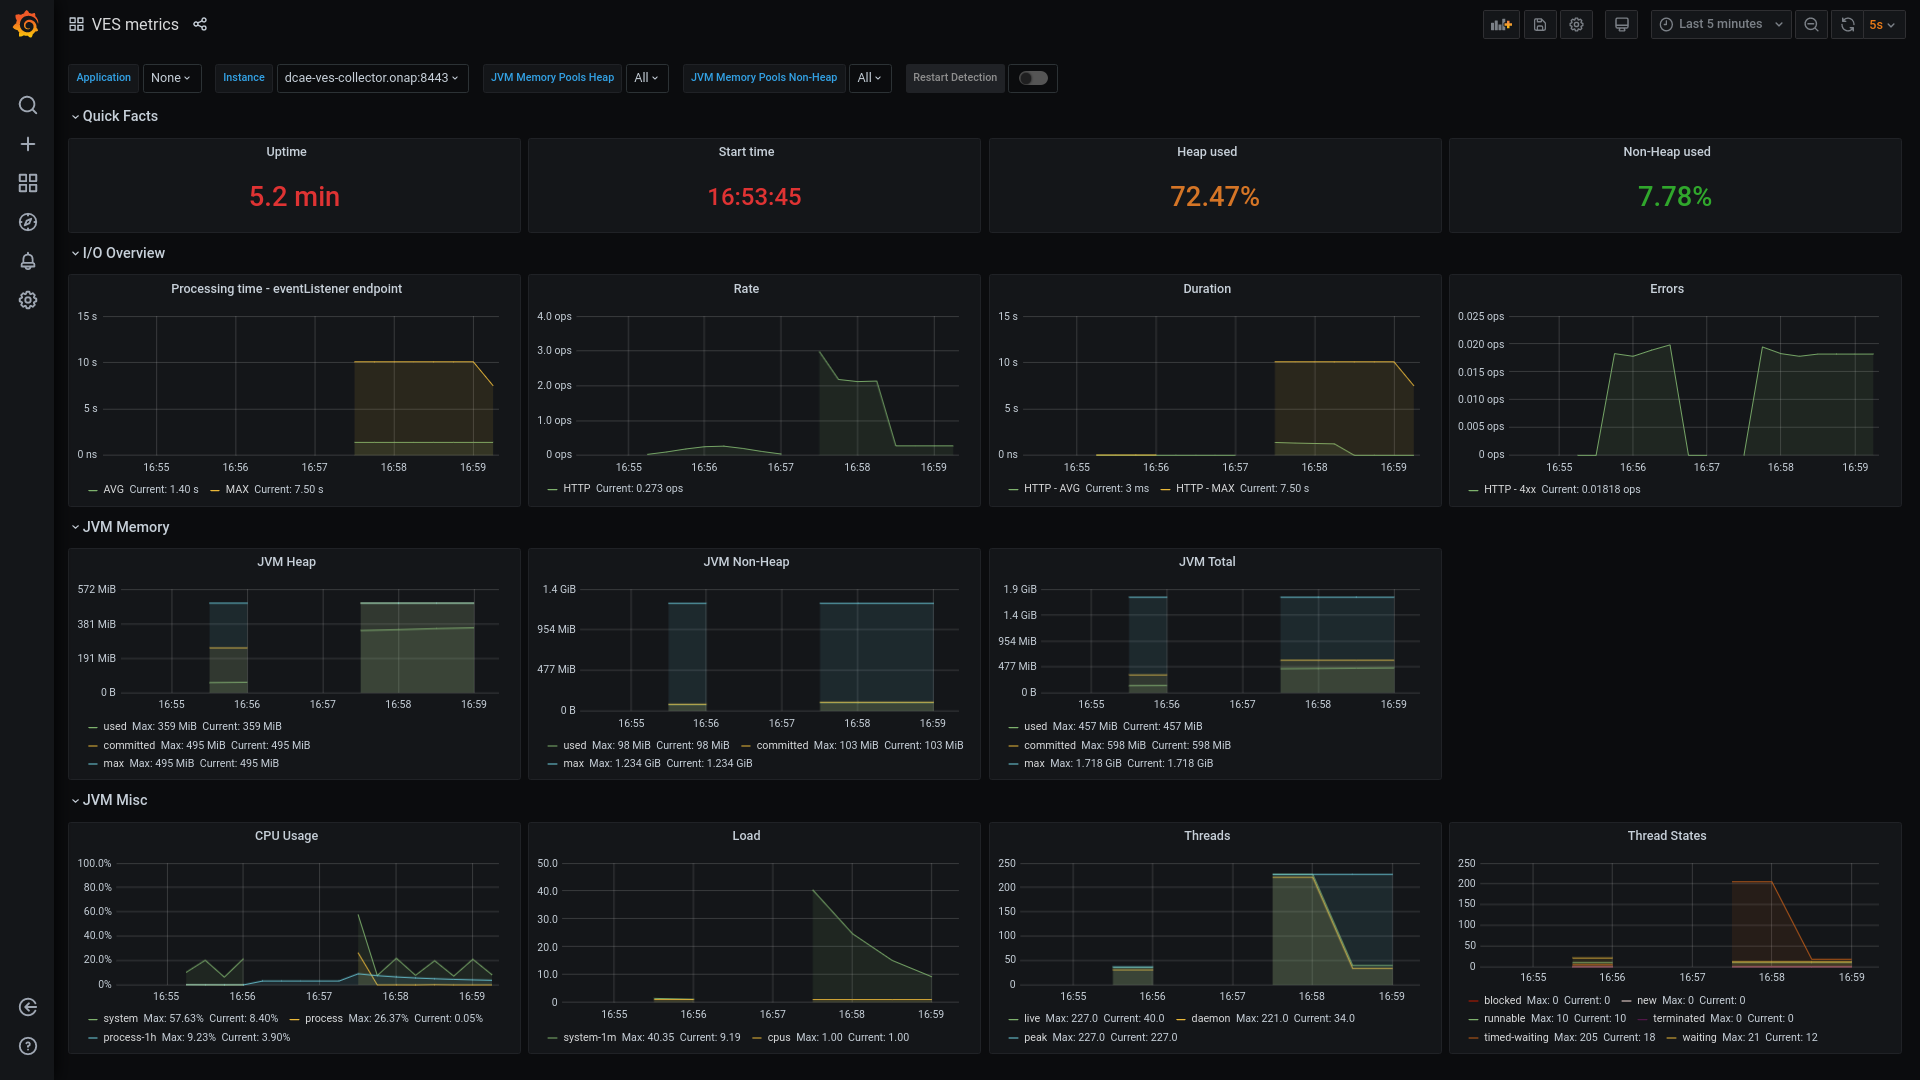
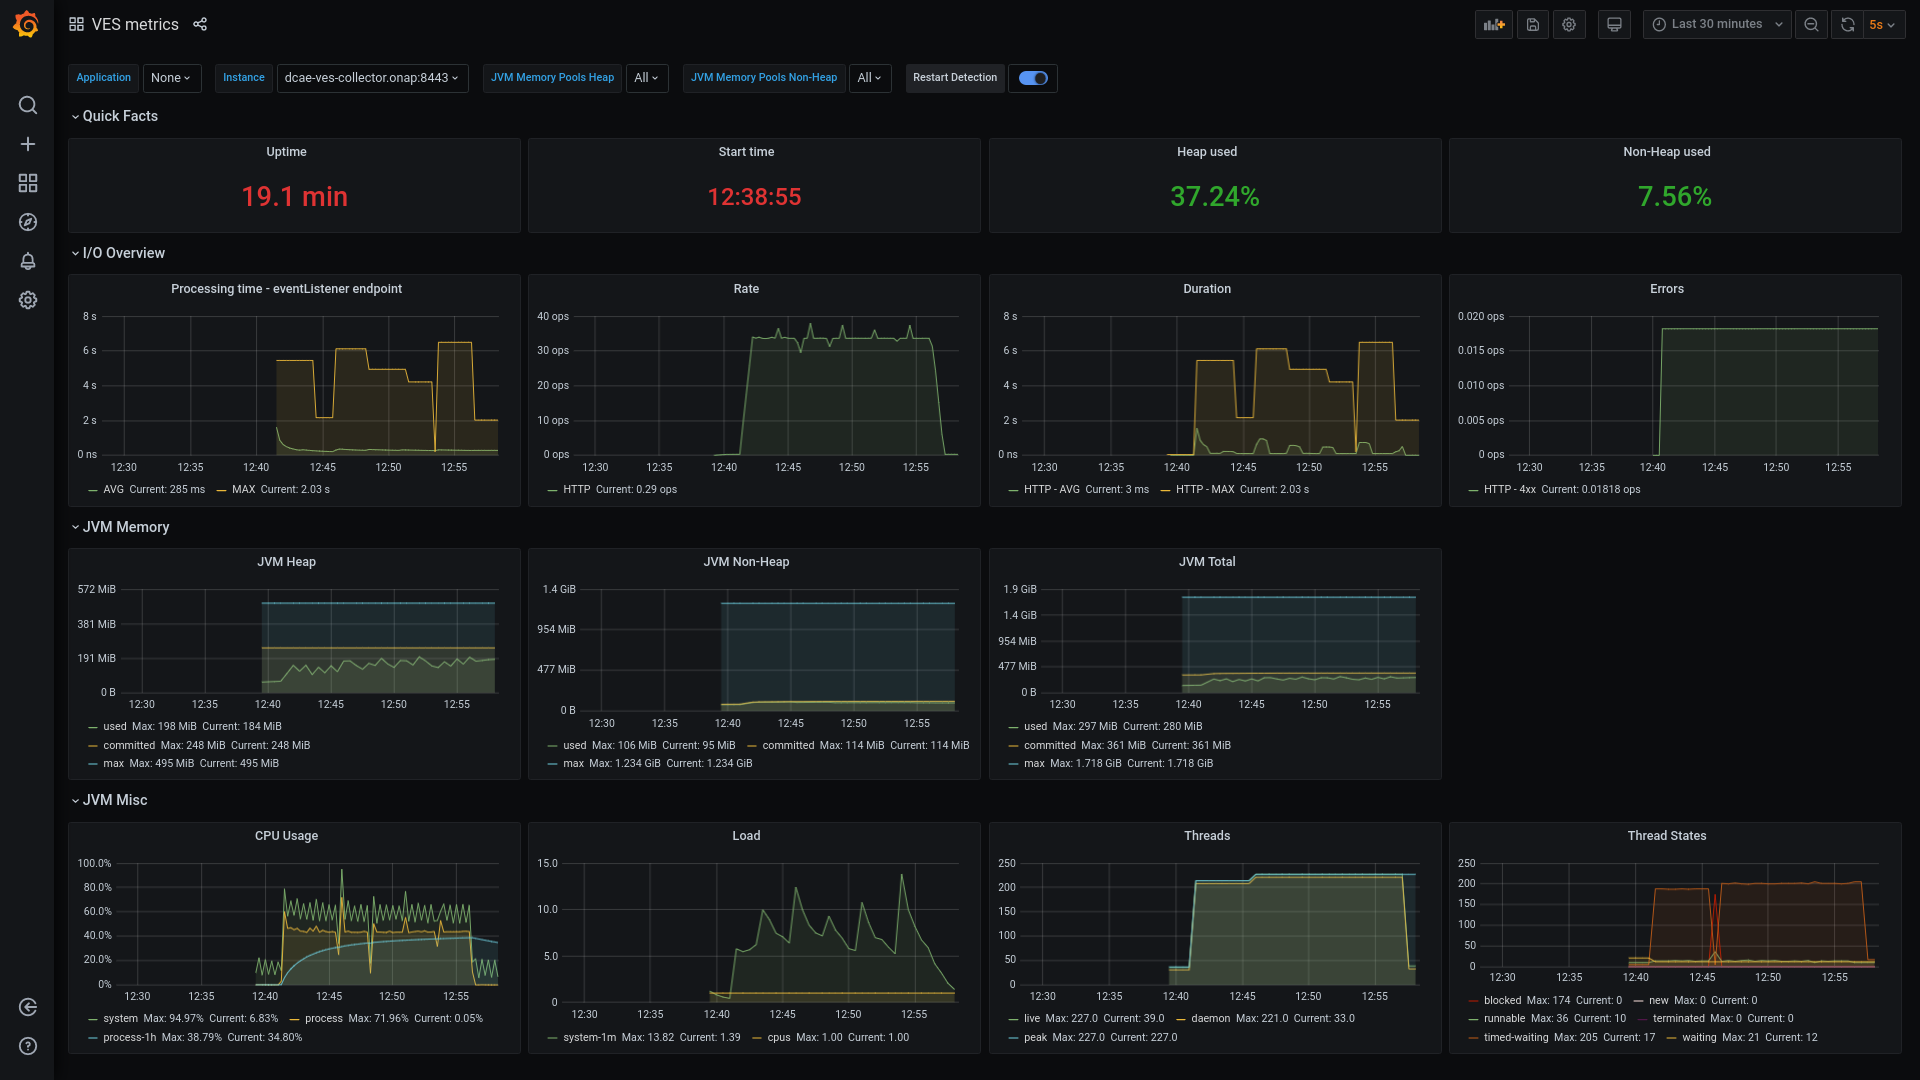
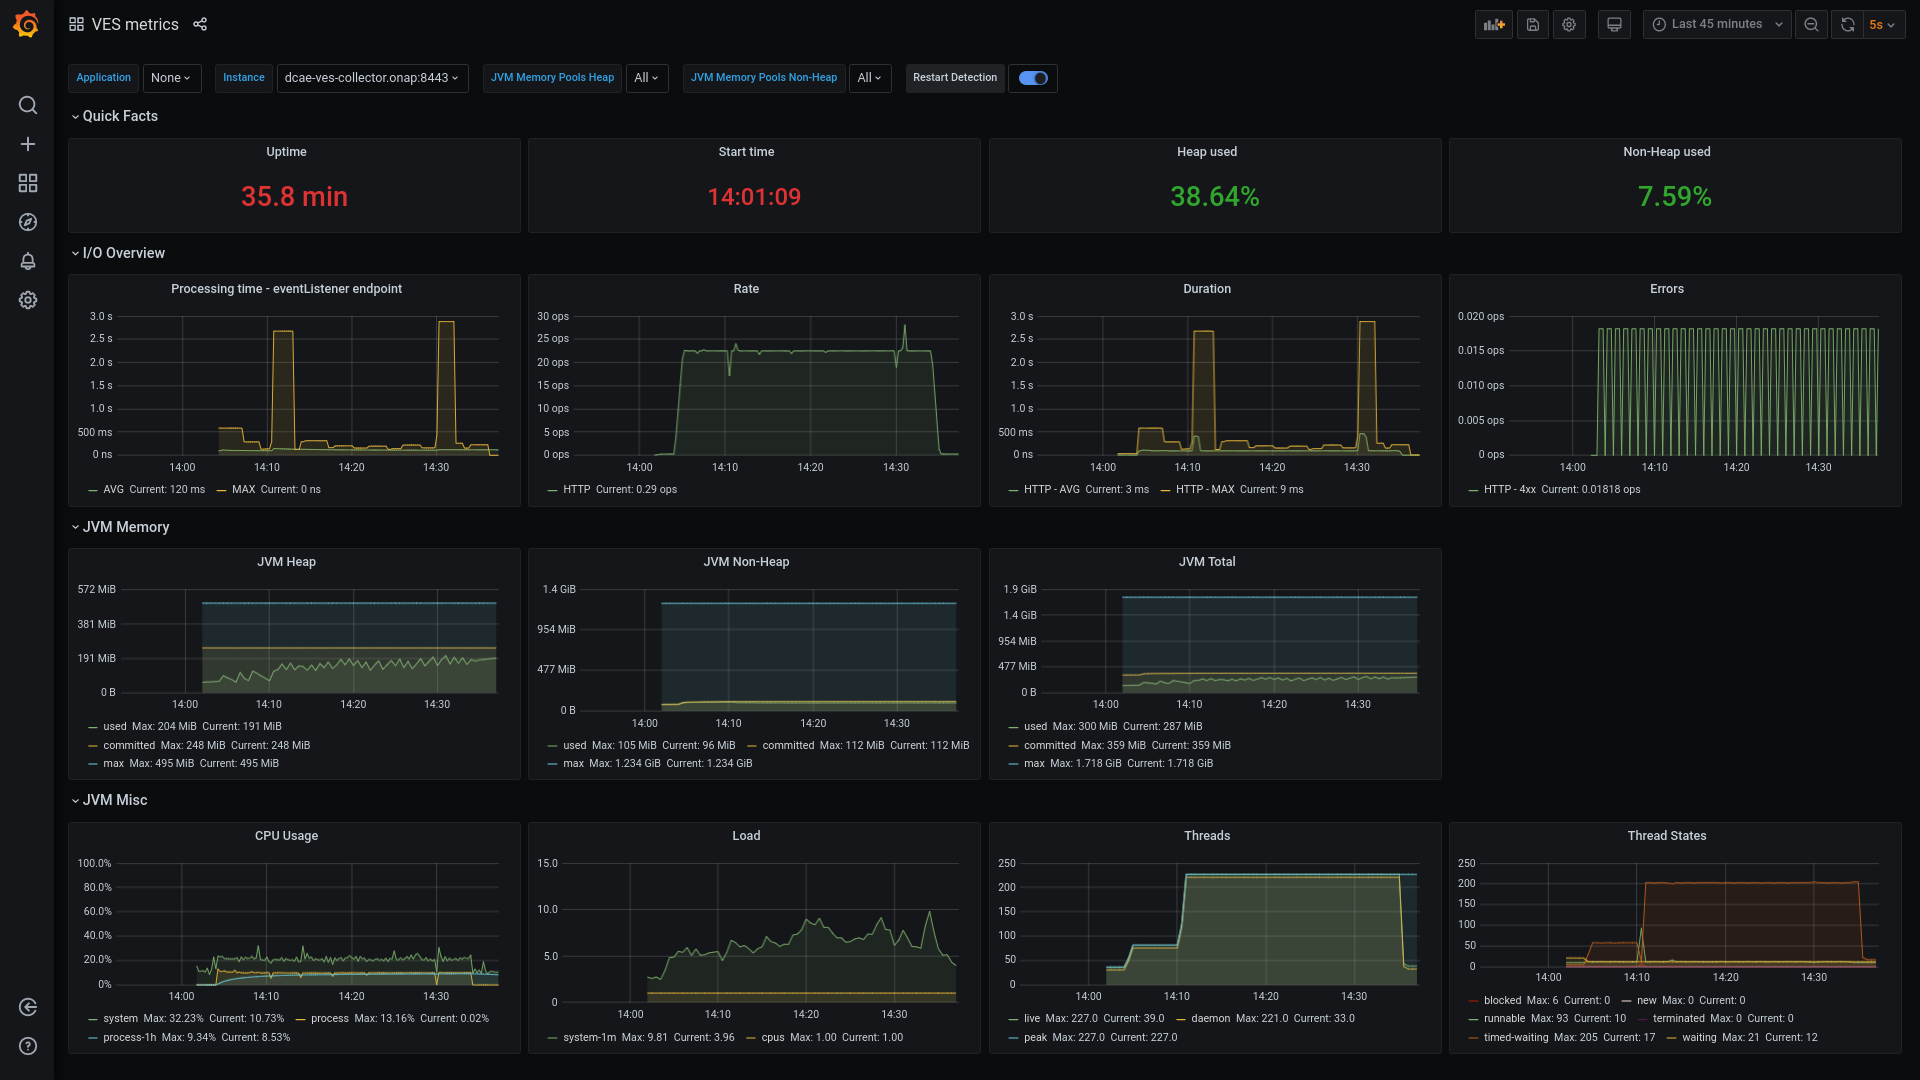
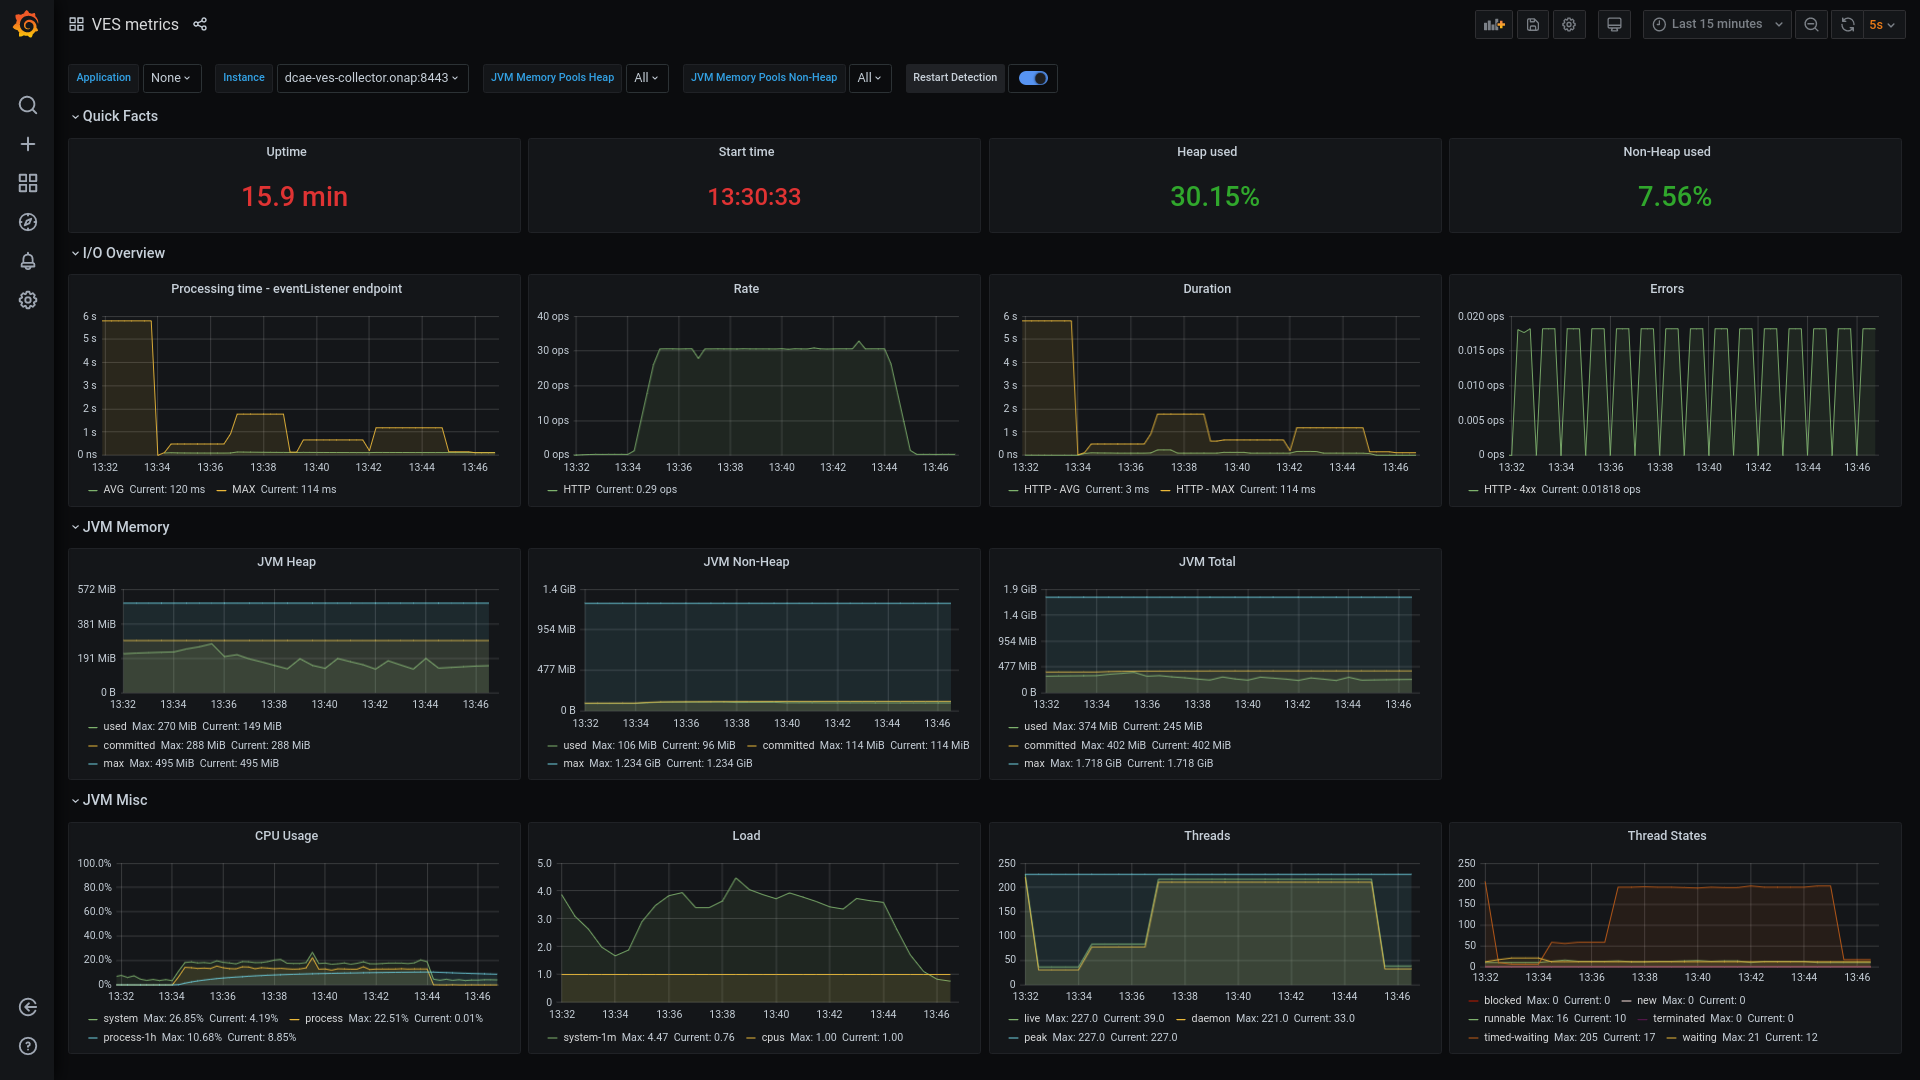
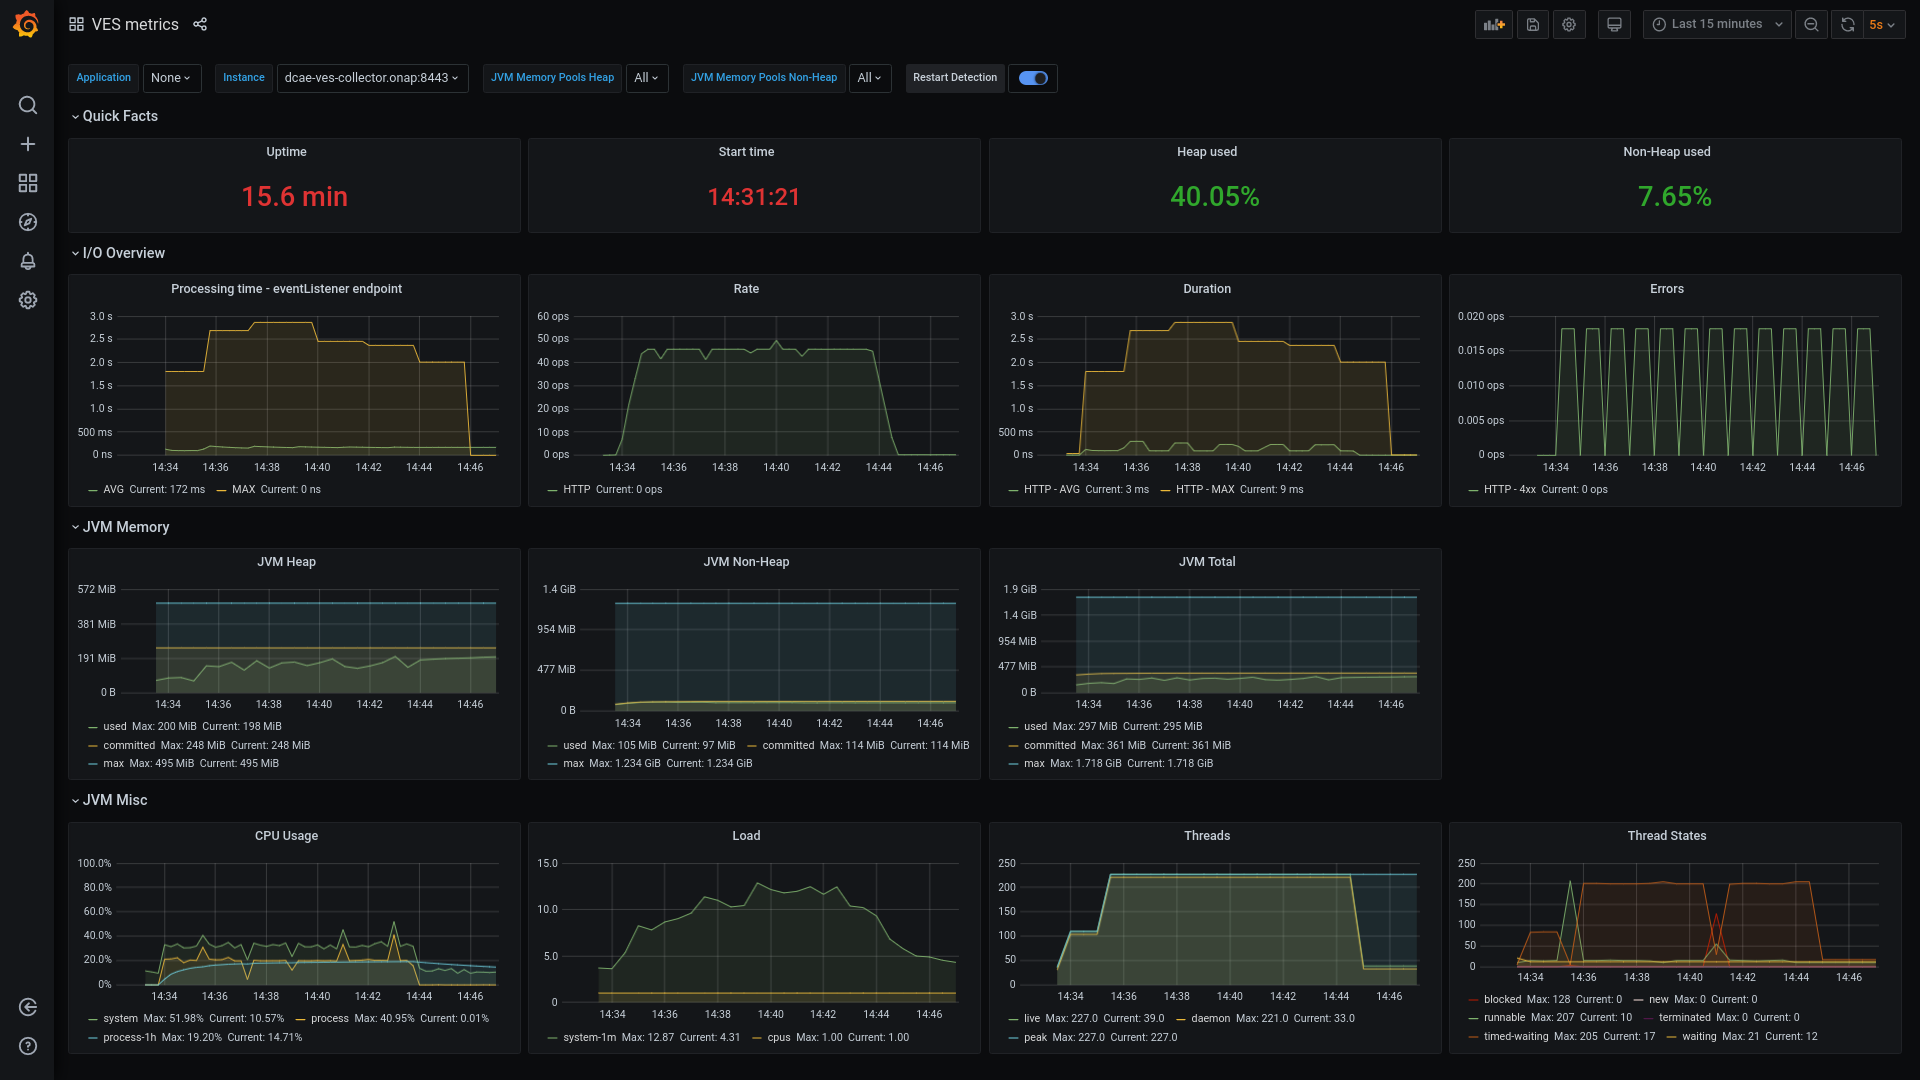
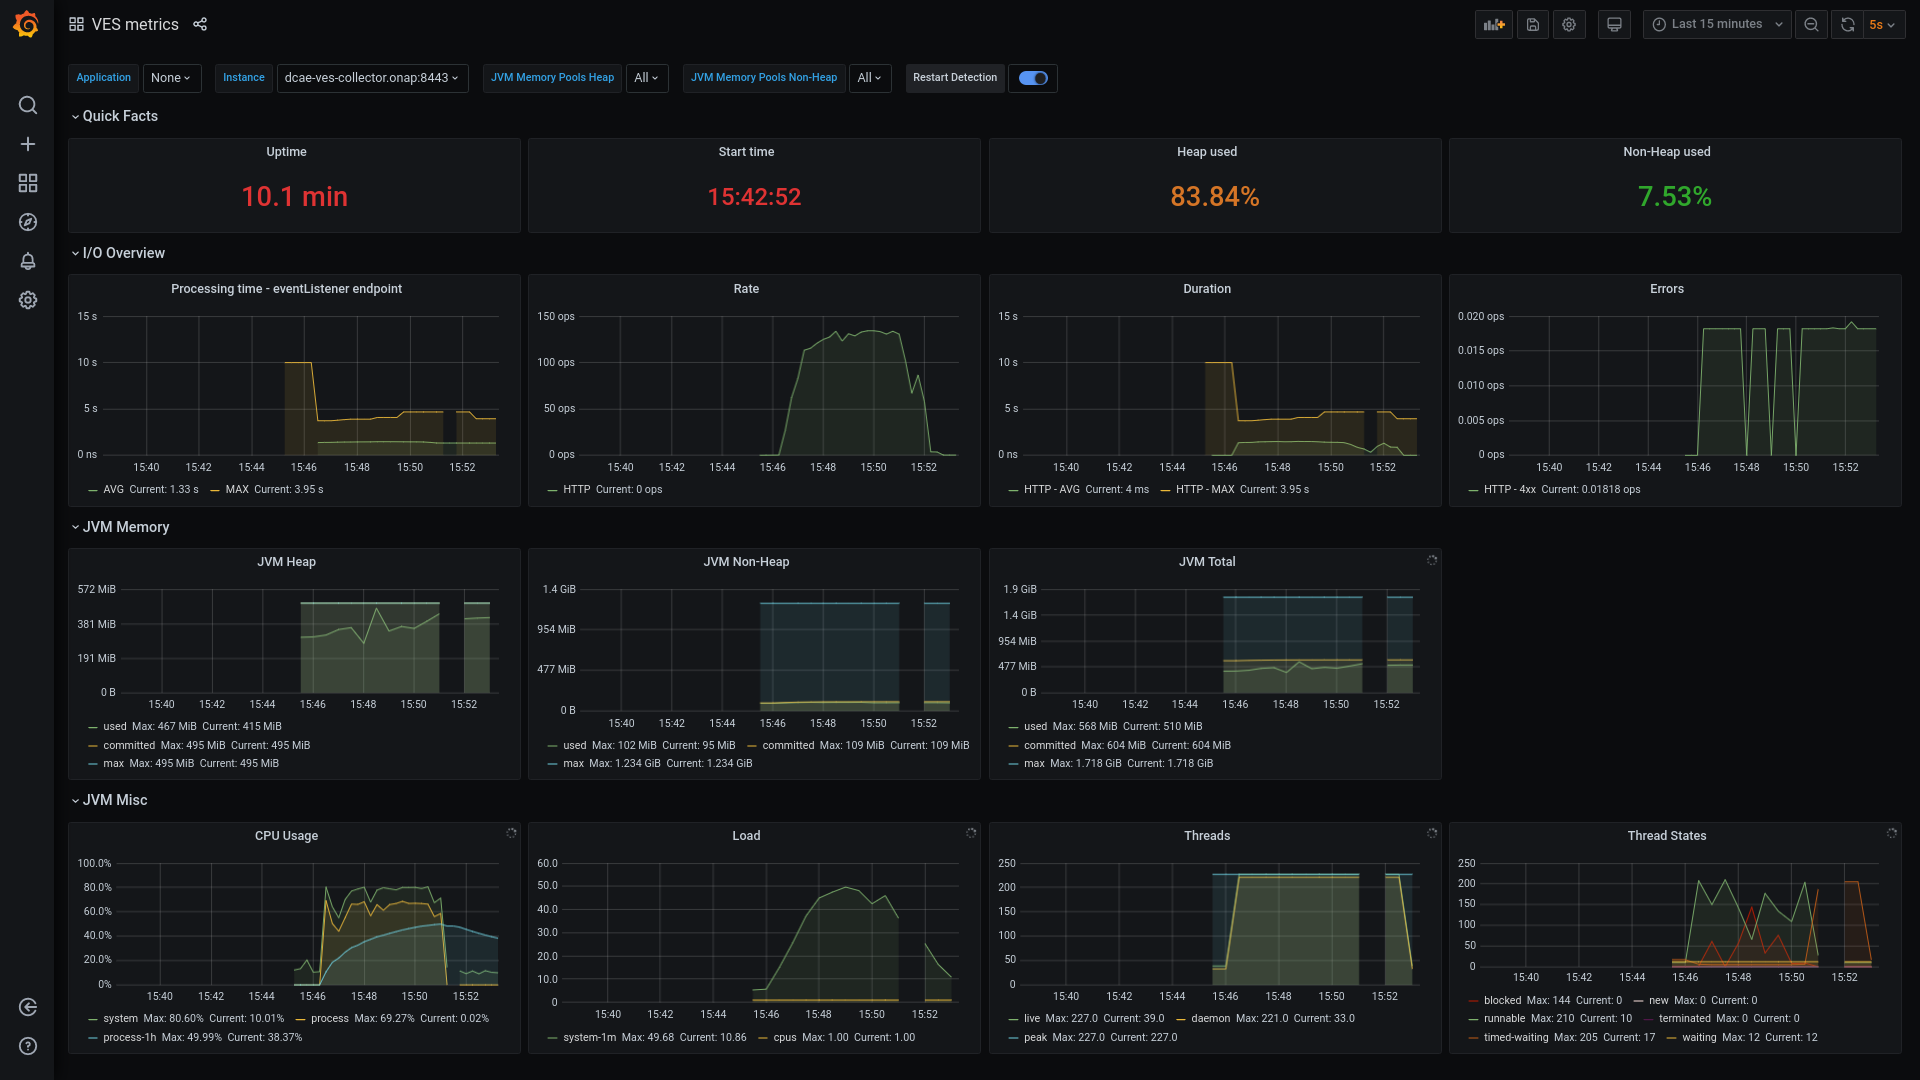
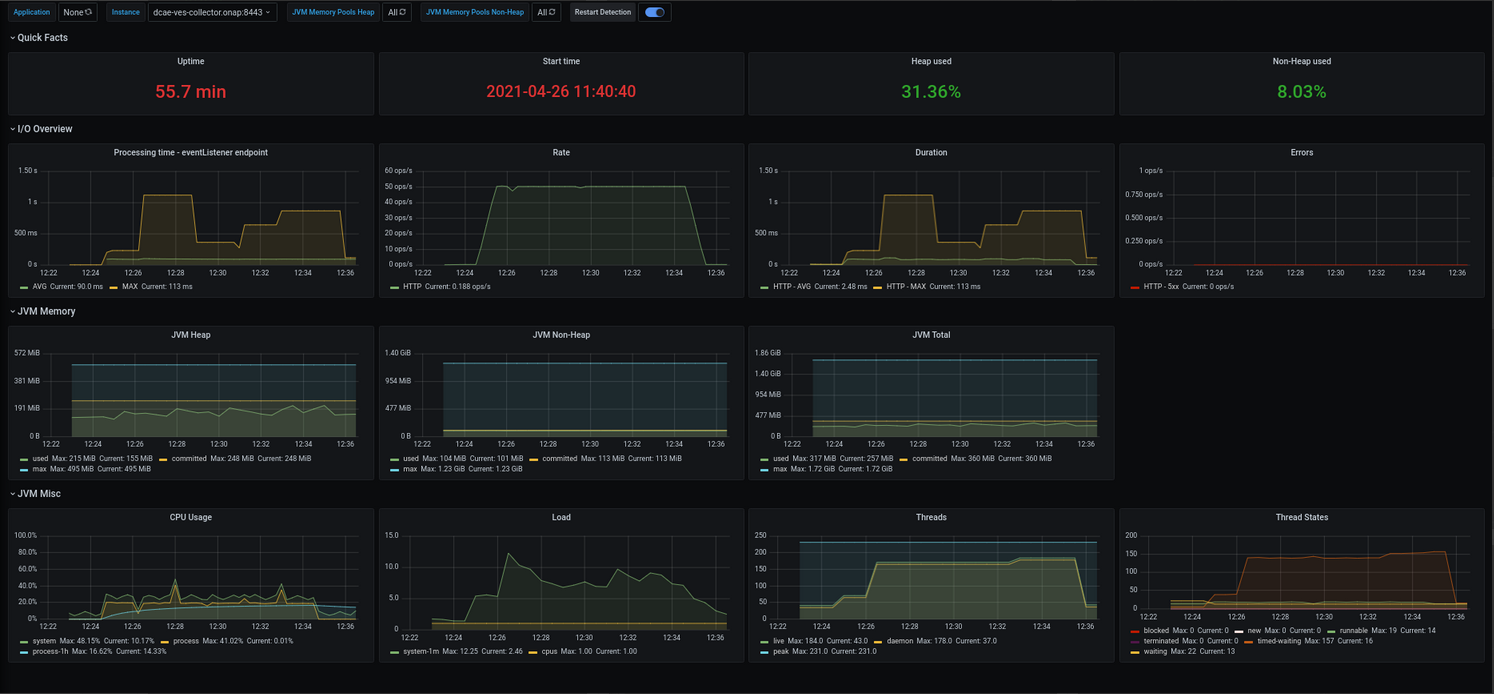
Ves metrics
- Uptime - how long VES is running
- Start time - when VES has been started
- Heap used - current Heap usage in percentages
- Non-Heap used - current Non-Heap usage in percentages
- Processing time eventListener endpoint - method execution time in VES
- Rate - number of HTTP requests per second
- Duration - maximum and average HTTP request processing time (HTTP request other than 5xx) in milliseconds
- Errors - number of 4xx and 5xx requests per second
- JVM Heap - JVM Heap usage
- used - the amount of used memory
- committed - the amount of memory in bytes that is committed for the Java virtual machine to use
- max - the maximum amount of memory in bytes that can be used for memory management
- JVM Non-Heap - JVM Non-Heap usage
- used, committed, max as in JVM Heap
- JVM Total - JVM Heap + JVM Non-Heap
- used, committed, max as in JVM Heap
- CPU Usage - VES CPU usage (Note, that VES can use the whole CPU available on the Worker Node)
- system - CPU usage for the whole system
- process - CPU usage for the Java Virtual Machine process
- process-1h - average CPU usage for the Java Virtual Machine process over 1h
- Load
- system-1m - number of runnable entities queued to available processors and the number of runnable entities running on the available processors averaged over a period of time
- cpus - the number of processors available to the Java virtual machine
- Threads
- live - the current number of live threads including both daemon and non-daemon threads
- daemon - the current number of live daemon threads
- peak - the peak live thread count since the Java virtual machine started or peak was reset
- Thread States - The current number of threads depending on the state
- runnable
- blocked
- waiting
- timed-waiting
- new
- terminated
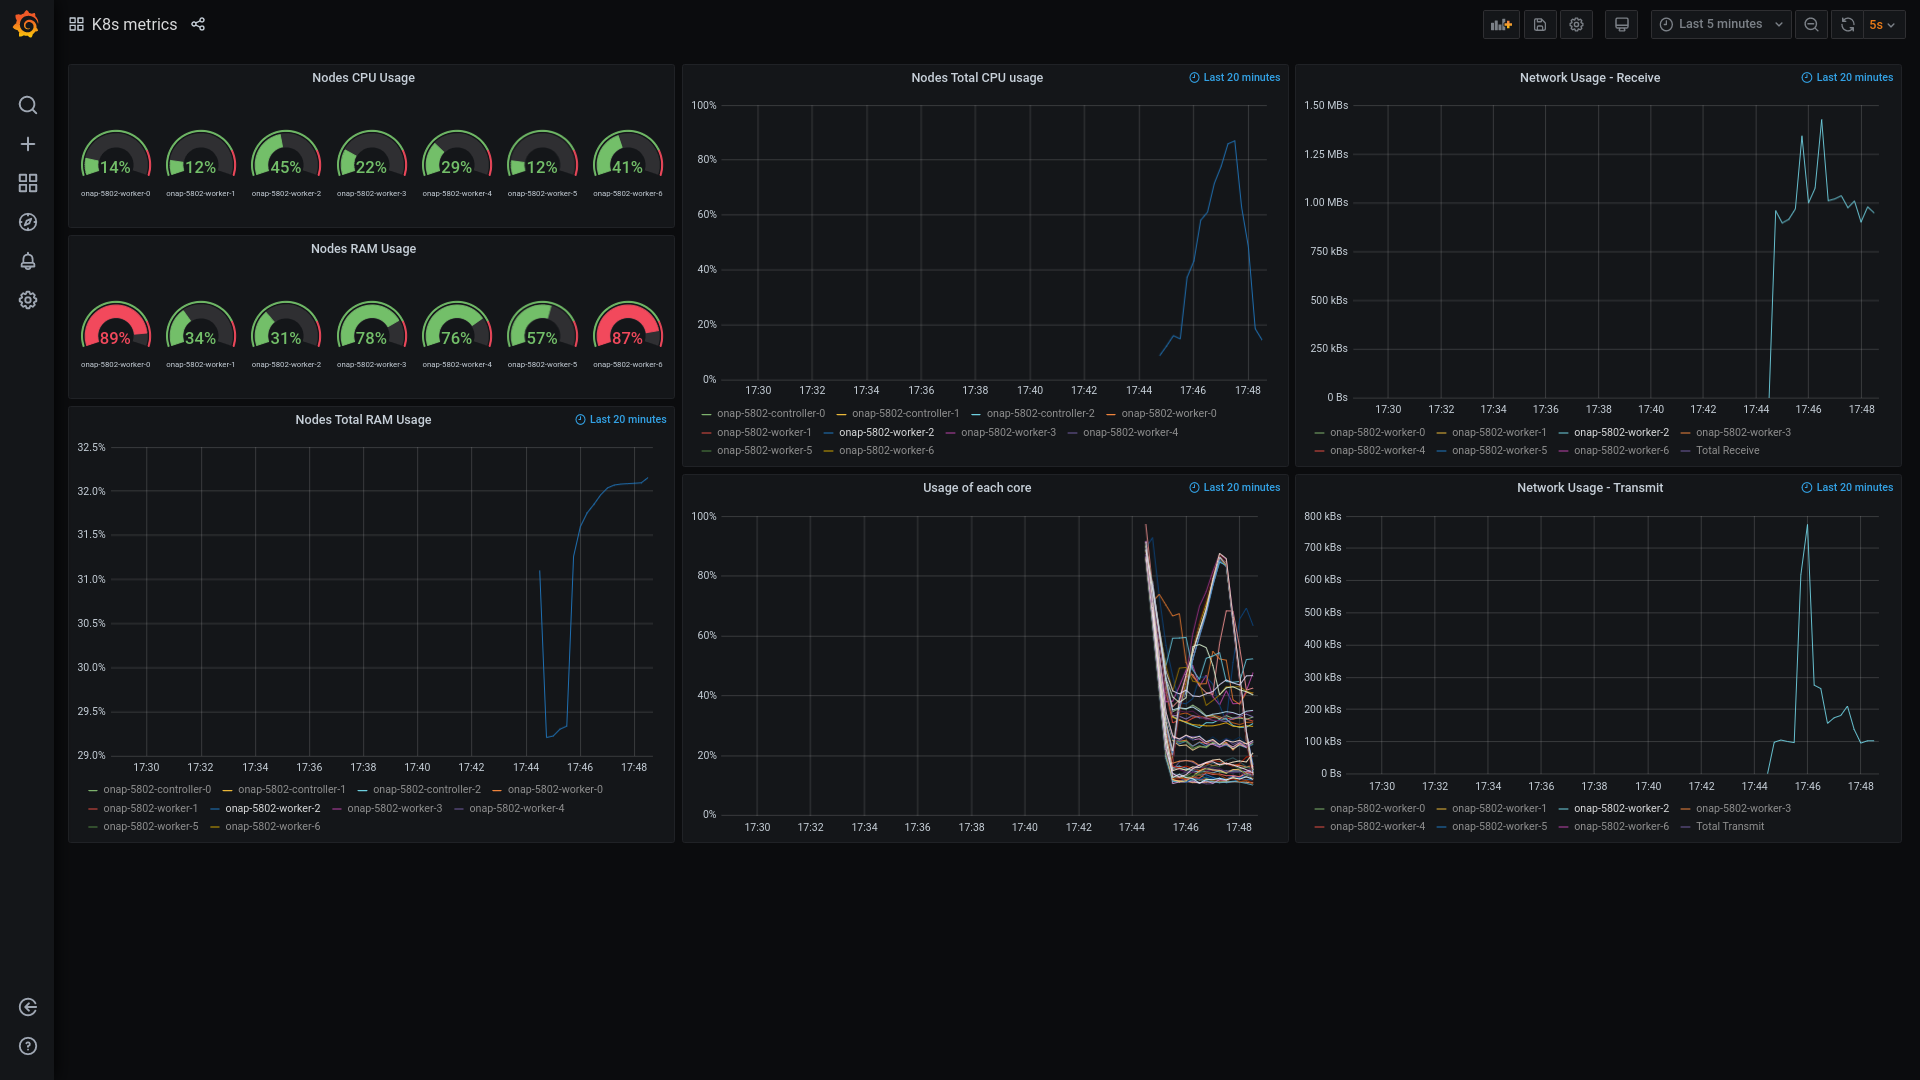
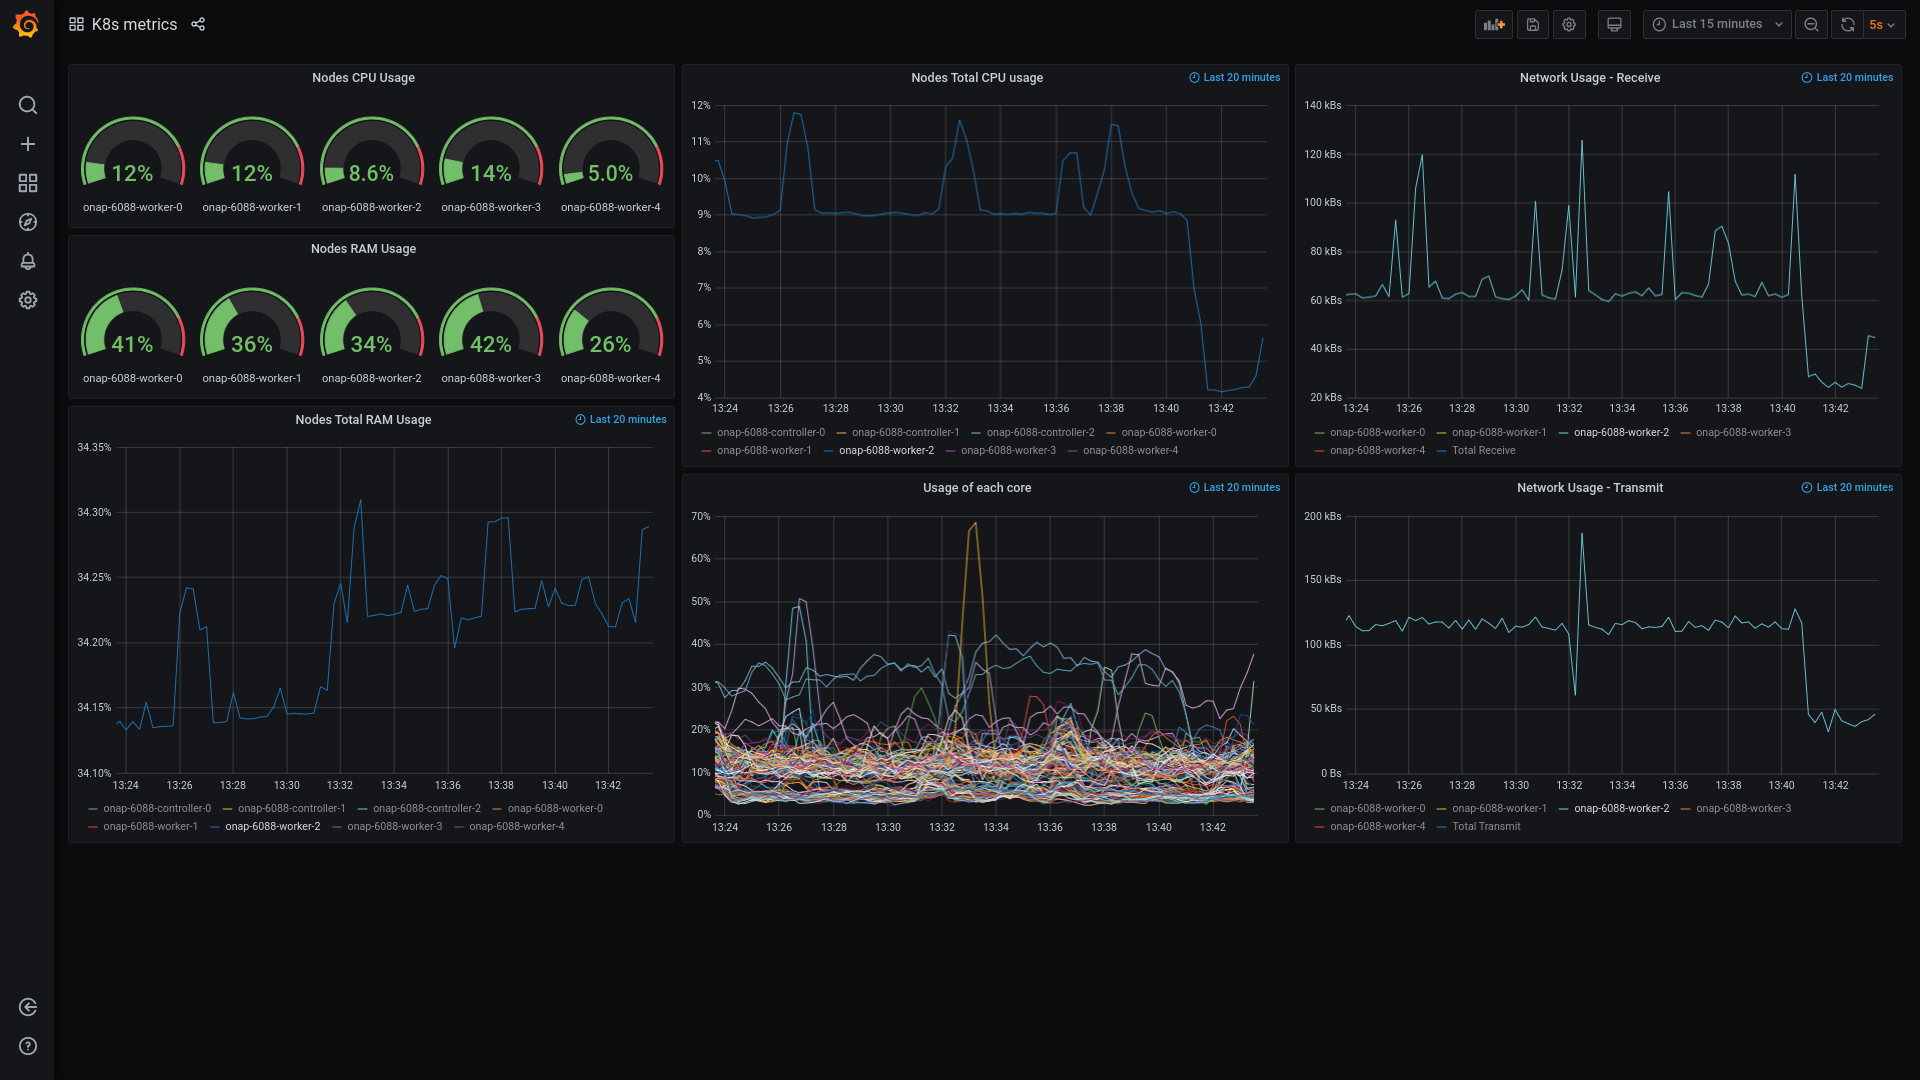
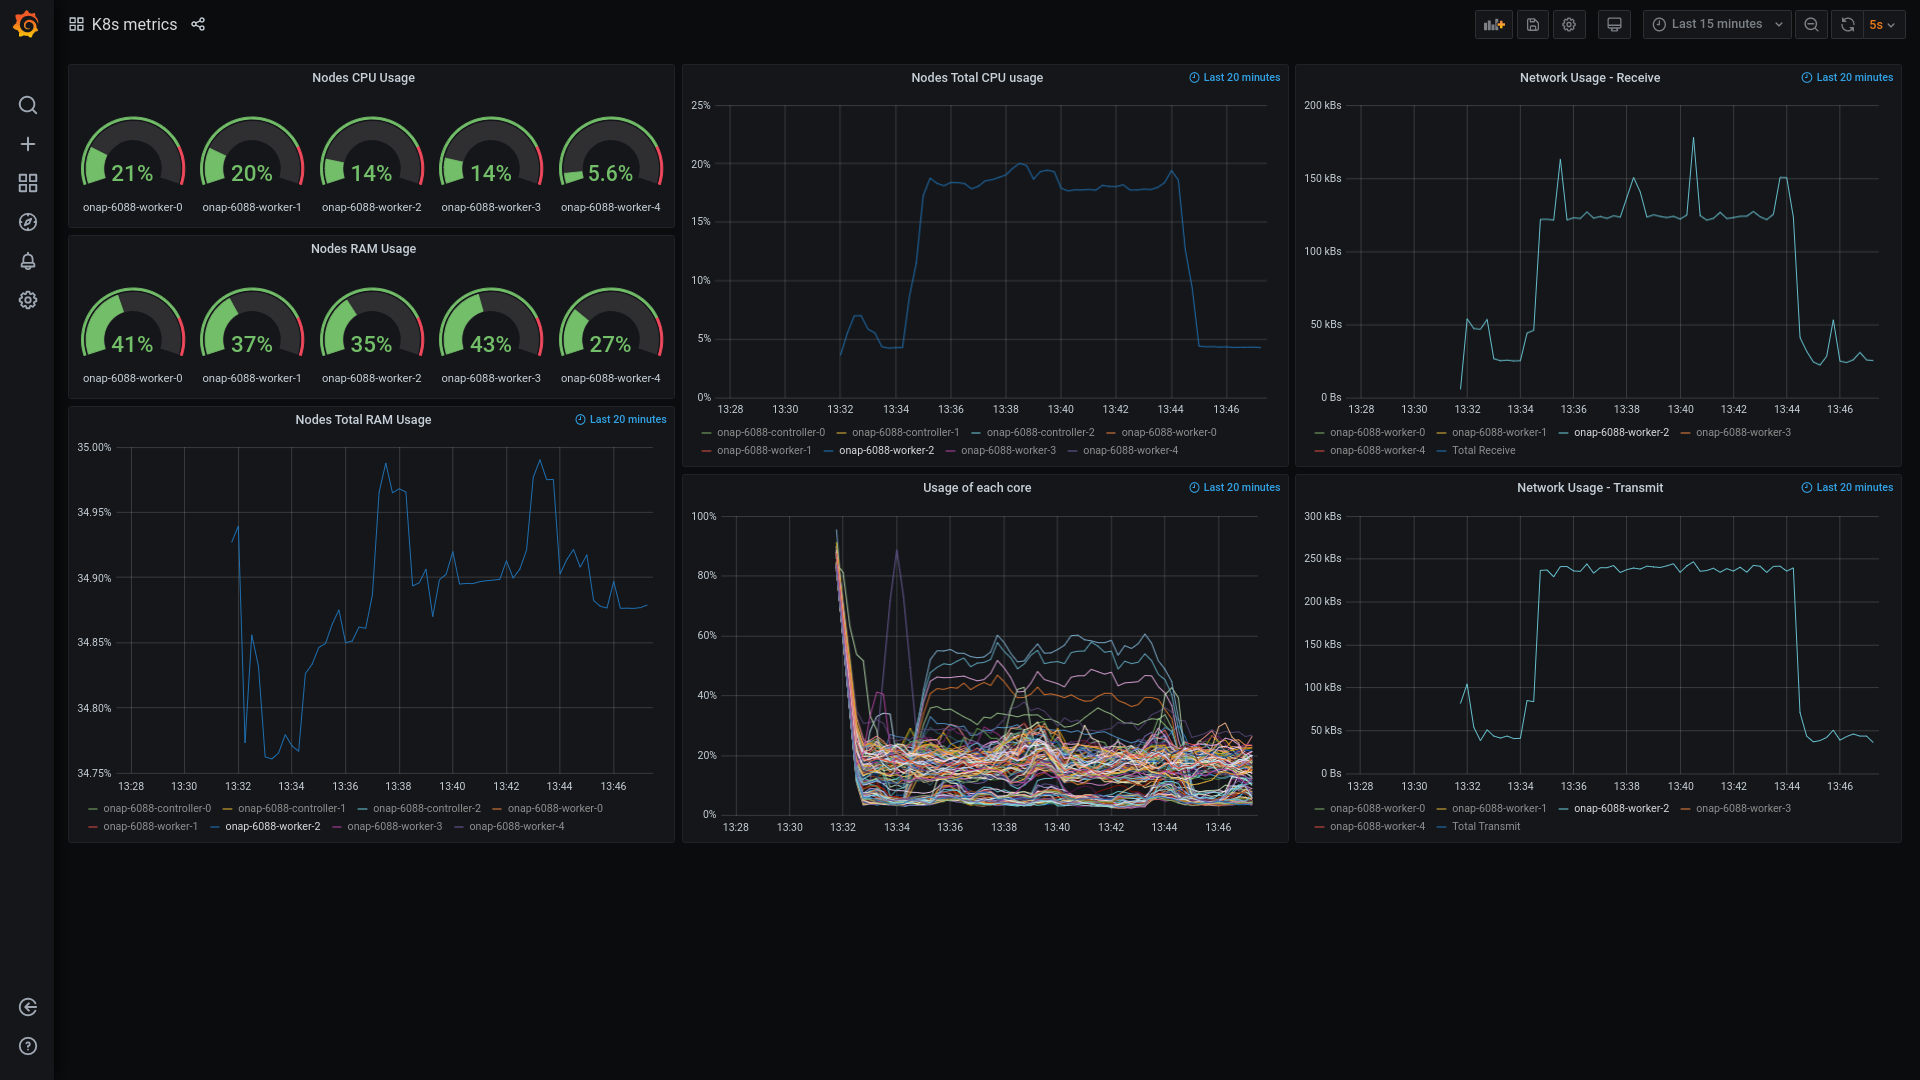
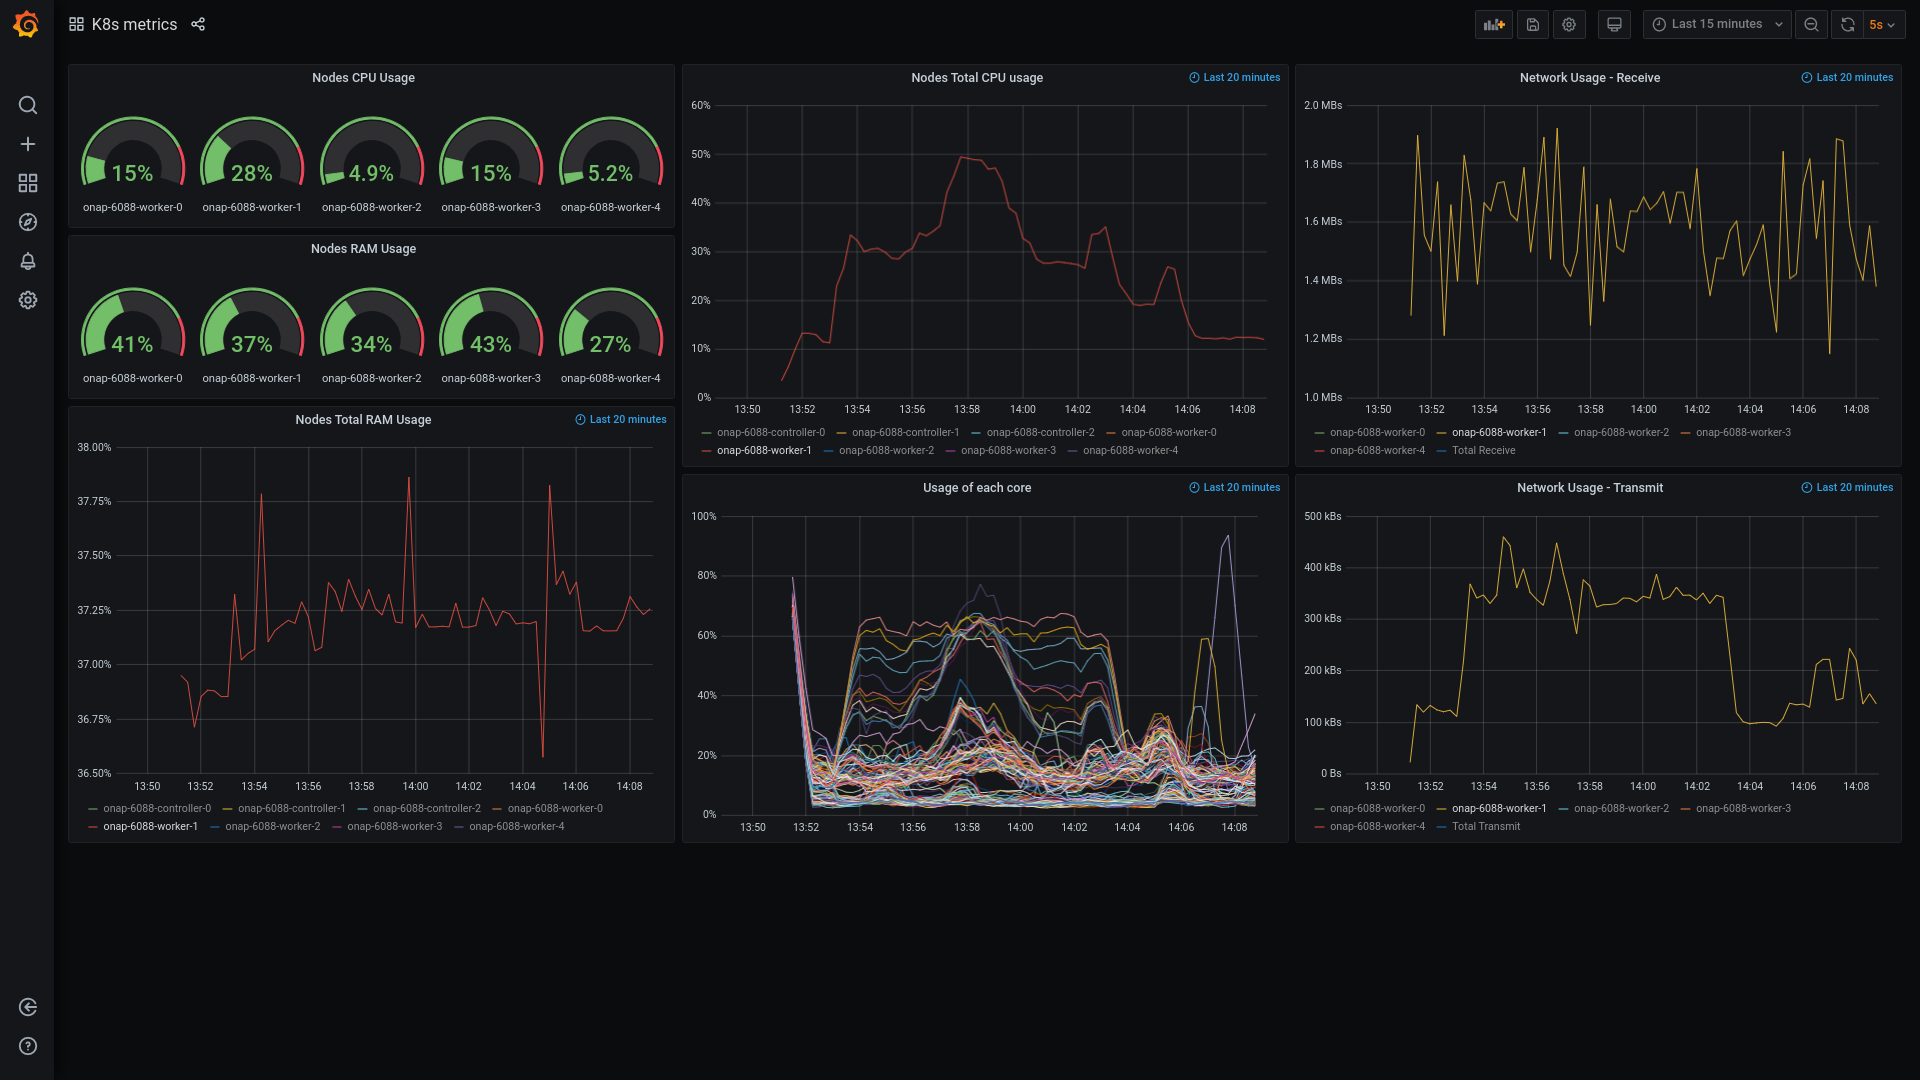
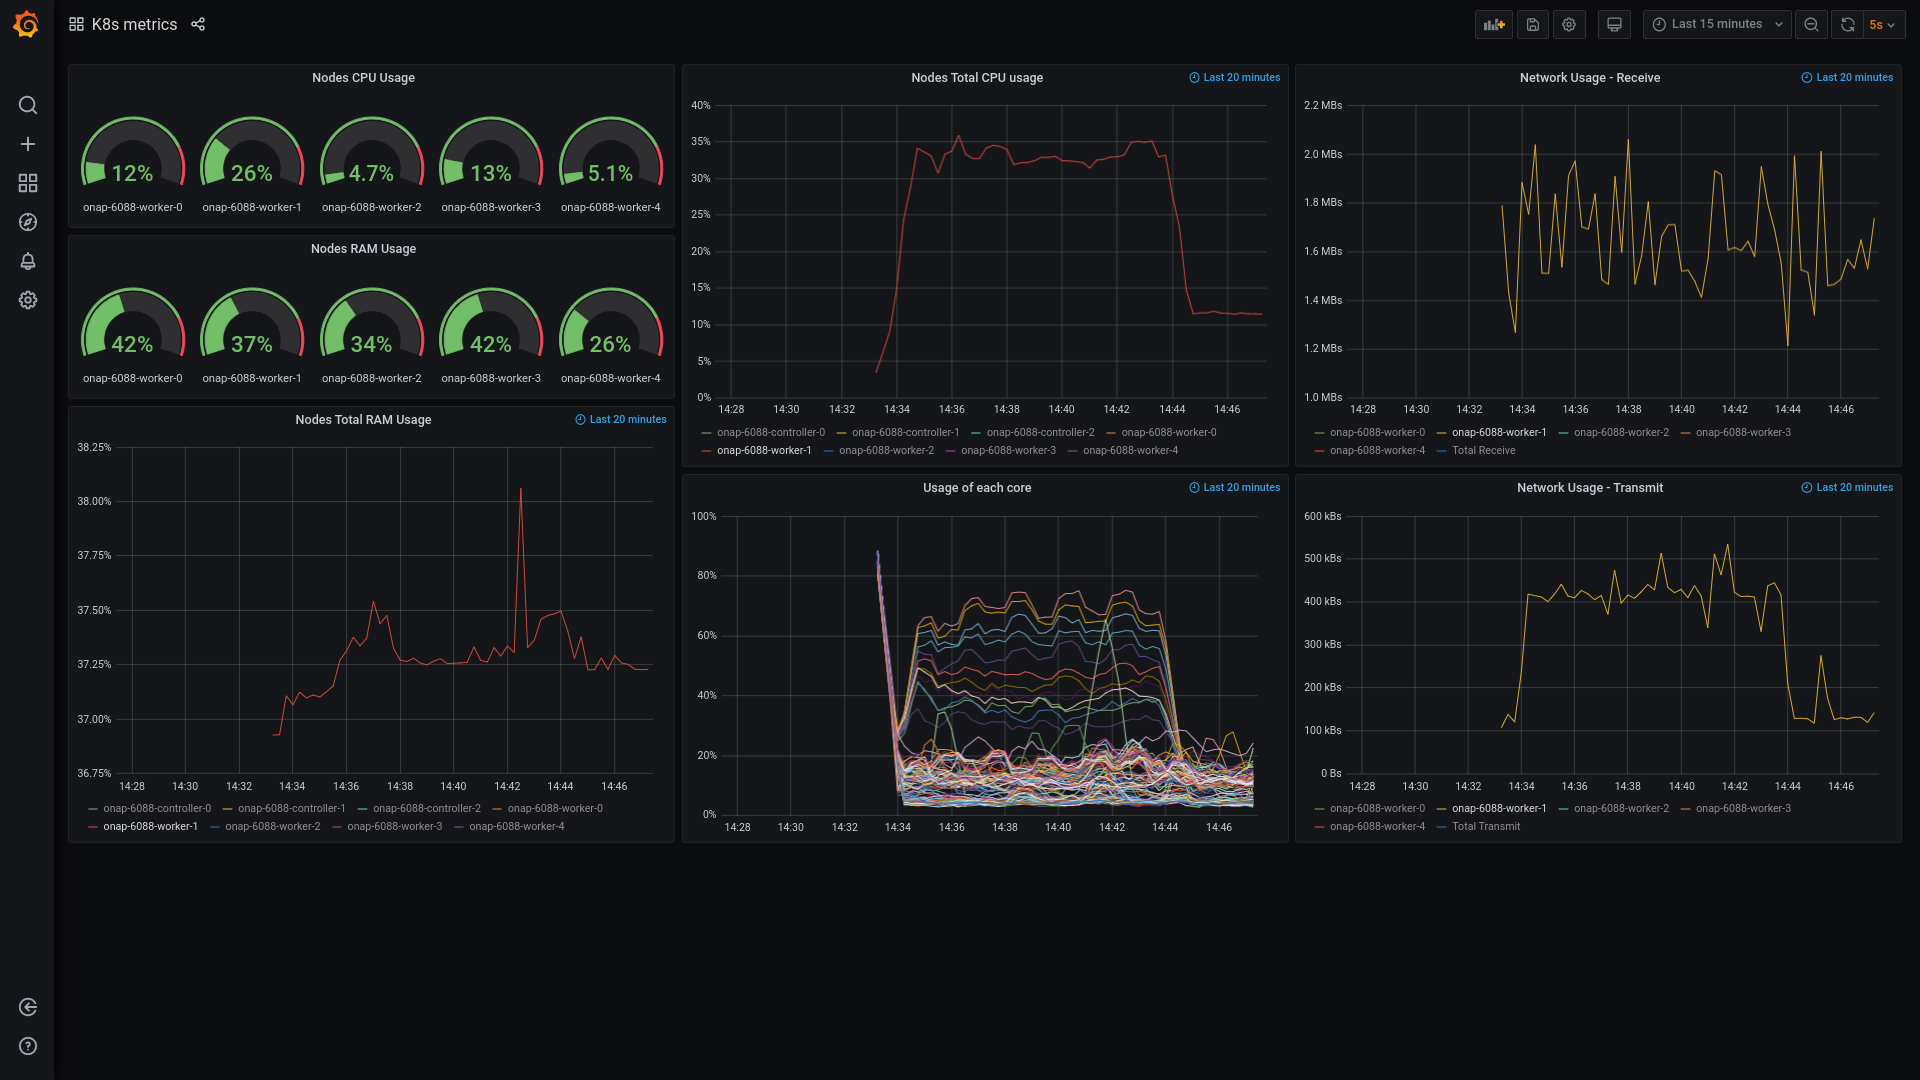
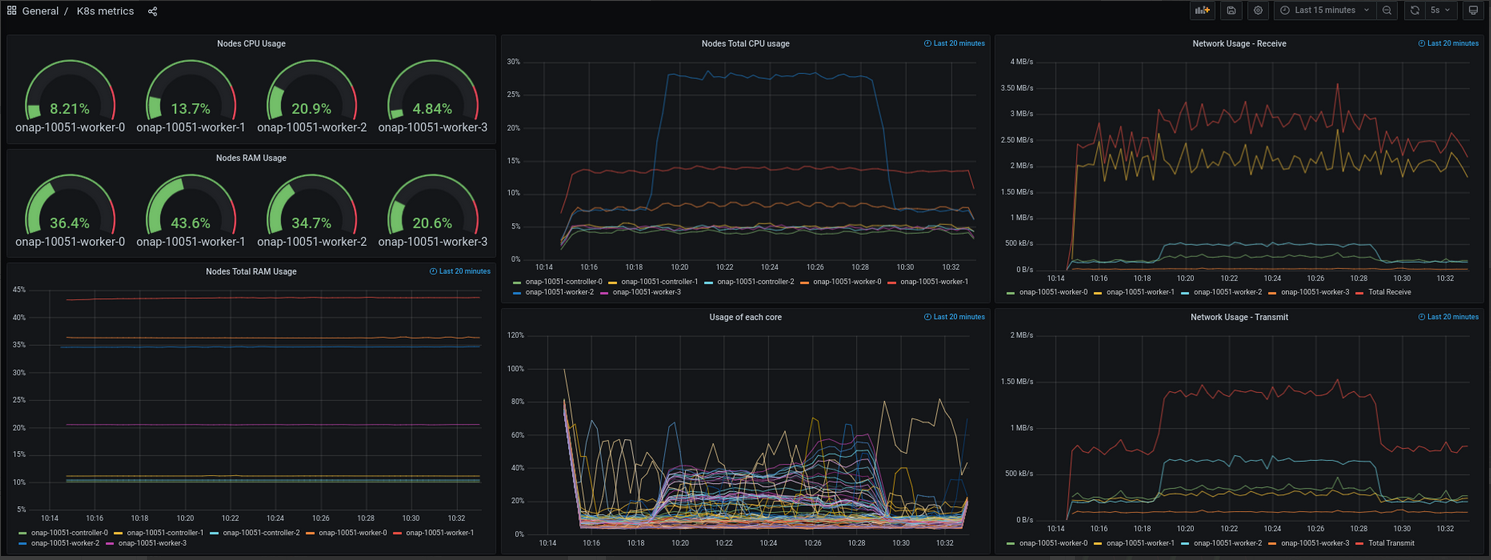
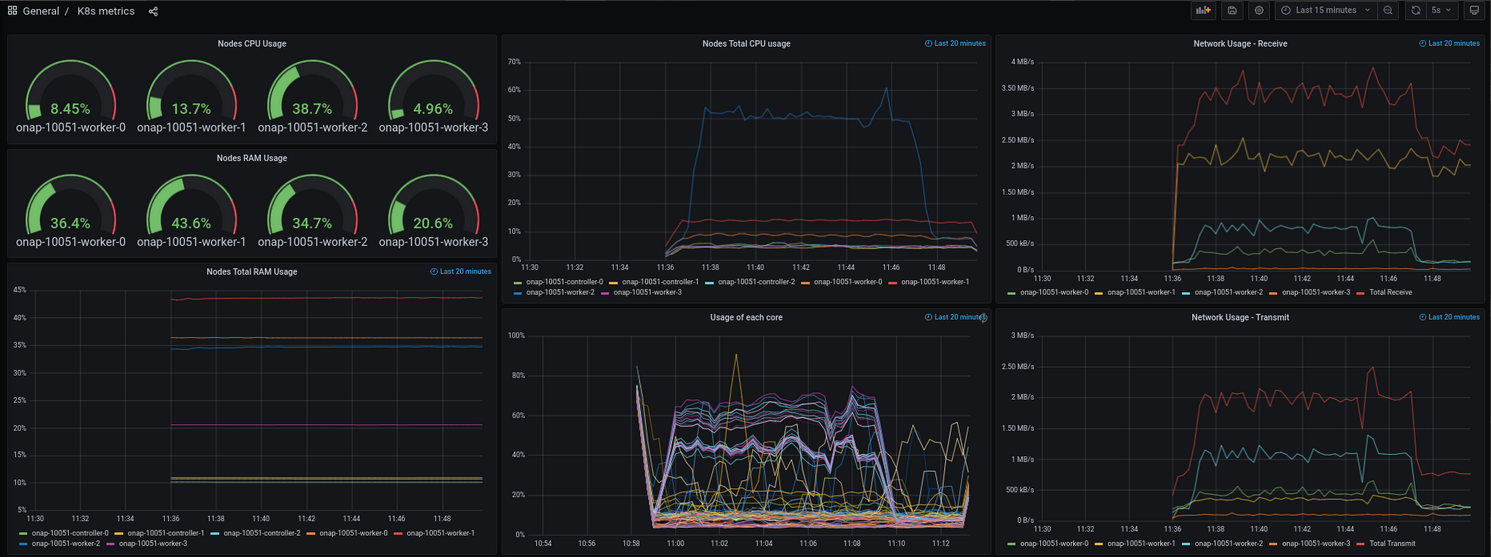
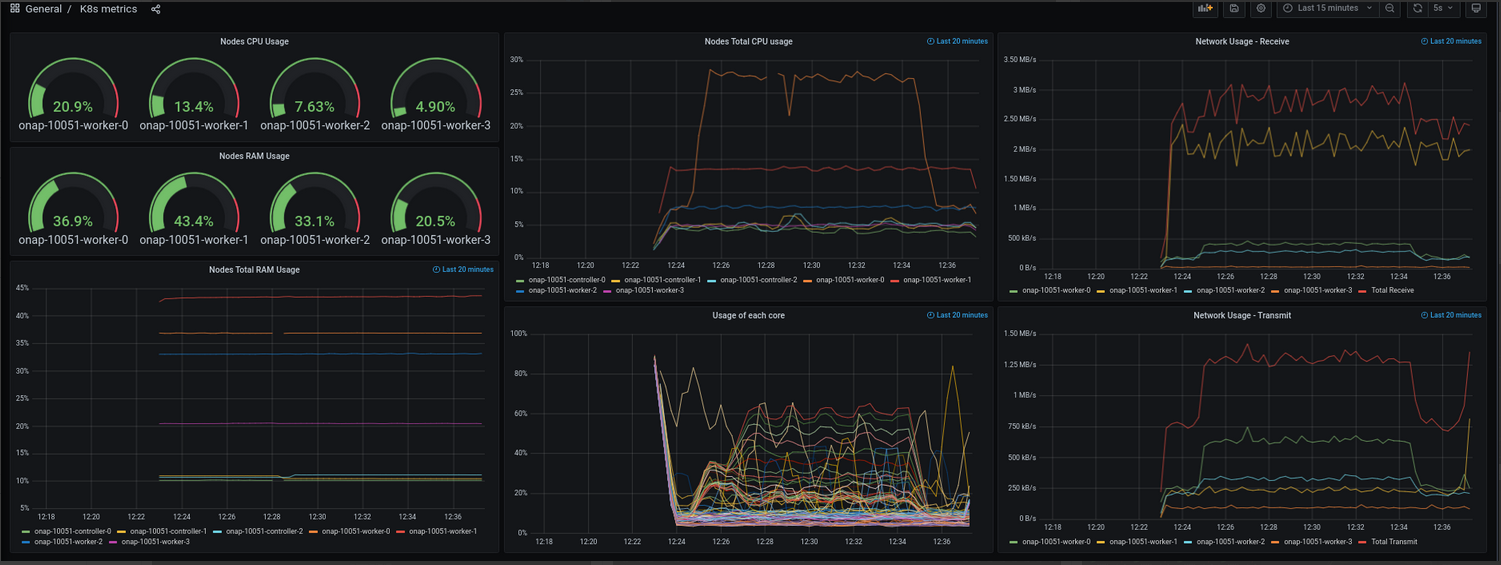
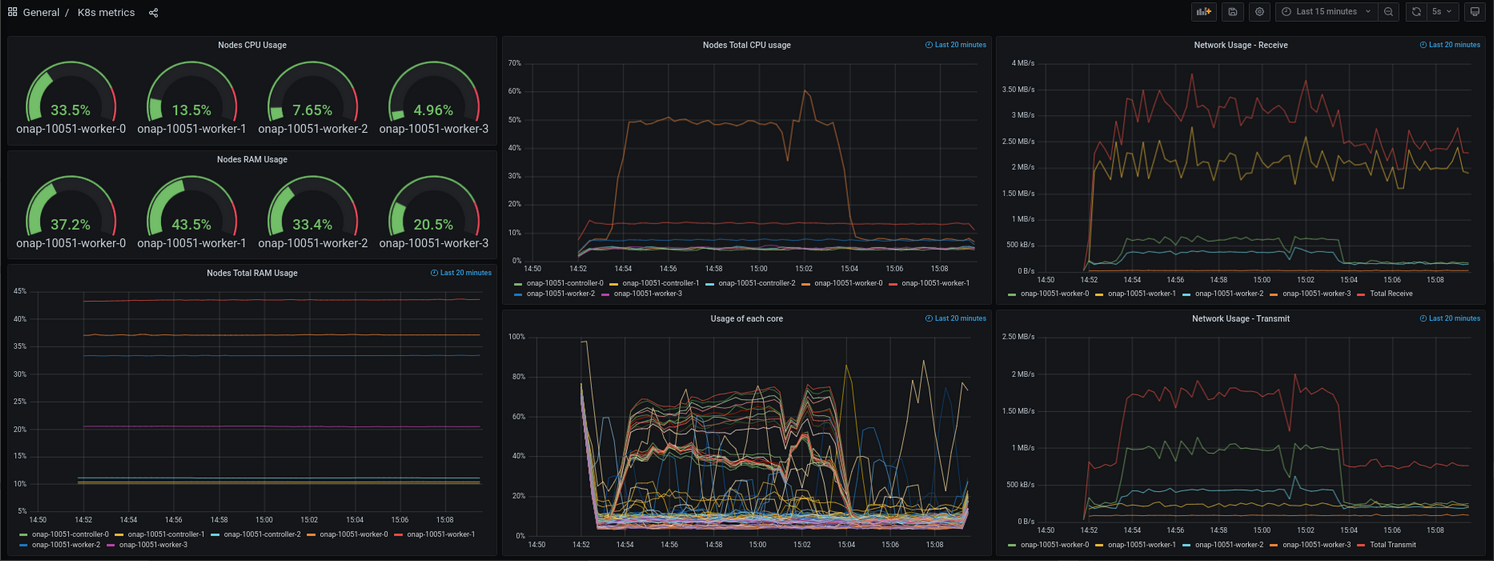
K8s metrics
- Nodes CPU Usage - current CPU usage on each worker node
- Nodes RAM Usage - current RAM usage on each worker node
- Nodes Total CPU usage - CPU usage on each node over time
- Network Usage Receive - incoming network traffic on each node in MBs
- Nodes Total RAM Usage - RAM usage on each node over time
- Usage of each core - CPU usage of each core on each worker node
- Network Usage Transmit - outgoing network traffic on each node in MBs
Results
Environment 1
- CPU - 8 cores
- CPU clock speed - 2.4 GHz
- Max Heap - 512 MB
- Start Heap - 256 MB
| Test scenario | Description | JMeter test results & metrics | Ves metrics | K8s metrics |
|---|---|---|---|---|
1_test_scenario_6_steps.jmx |
|  |  |  |
2_test_scenario_1k_rps.jmx |
|
|
|
|
2_test_scenario_2k_rps.jmx |
|
|
|
|
2_test_scenario_3k_rps.jmx |
|
|
|
|
| 2_test_scenario_4k_rps.jmx |
|
|
|
|
2_test_scenario_5k_rps.jmx |
|
|
|
|
| custom |
|
|
|
|
| custom |
|  |
|
|
| custom |
|
|
|
|
| custom |
|
|
|
|


Environment 2
- CPU - 24 cores
- CPU clock speed - 2.4 GHz
- Max Heap - 512 MB
- Start Heap - 256 MB
| Test scenario | Description | JMeter test results & metrics | Ves metrics | K8s metrics |
|---|---|---|---|---|
| custom |
|
|
|
|
| custom |
|
|
|
|
| custom |
|
|
|
|
| custom |
|
|
|
|
| custom |
|
|
|
|
| custom |
|
|
|
|
| custom |
|
|
|
|
| custom |
|
|
|
|
| custom |
|
|
|
|


| Test scenario | Description | JMeter test results & metrics | Ves metrics | Ves additional metrics |
|---|---|---|---|---|
| custom |
|
|
|
|


Presentation
 DCAEGEN2 VES performance tests.odp
Replacing Cambria with DMaaP Client
Presentation
Performance Tests with real DMaaP
Environment
- CPU - 24 cores
- CPU clock speed - 2.4 GHz
- Max Heap - 512 MB
- Start Heap - 256 MB
Ves with Dmaap client
| 3_test_scenario_50_rps_time_600.jmx | 50RPS → 10min |
|
|
|
| 3_test_scenario_50_rps_time_600.jmx | 50RPS → 10min |
|
|
|
| 3_test_scenario_50_rps_time_600.jmx | 50RPS → 10min |
|
|
|
| 3_test_scenario_100_rps_time_600.jmx | 100RPS → 10min |
|
|
|
| 3_test_scenario_100_rps_time_600.jmx | 100RPS → 10min |
|
|
|
| 3_test_scenario_100_rps_time_600.jmx | 100RPS → 10min |
|
|
|


Ves with Cambria client
Ves version : 1.9.1
| 3_test_scenario_50_rps_time_600.jmx | 50RPS → 10min |
|
|
|
| 3_test_scenario_50_rps_time_600.jmx | 50RPS → 10min |
|
|
|
| 3_test_scenario_50_rps_time_600.jmx | 50RPS → 10min |
|
|
|
| 3_test_scenario_100_rps_time_600.jmx | 100RPS → 10min |
|
|
|
| 3_test_scenario_100_rps_time_600.jmx | 100RPS → 10min |
|
|
|
| 3_test_scenario_100_rps_time_600.jmx | 100RPS → 10min |
|
|
|


Summary test results:
Environment
- CPU - 24 cores
- CPU clock speed - 2.4 GHz
- Max Heap - 512 MB
- Start Heap - 256 MB
| Average and Max Sync Processing Time (Client → VES) | Average VES Processing time | Error Rate [%] | Max CPU Usage [%] | |||
|---|---|---|---|---|---|---|
| VES with Dmaap | 50th percentile | 95th percentile | 99th percentile | |||
| 50RPS → 10min | 122ms, 349ms | 181ms, 3.23s | 591ms, 4.43s | 91ms | 0 | 36 |
| 124ms, 515ms | 204ms, 4.27s | 609ms, 5.48s | 90ms | 0 | 42 | |
| 121ms, 399ms | 177ms, 2.17s | 561ms, 5.22 | 91ms | 0 | 30 | |
| 100RPS → 10min | 274ms, 7.06 | 570ms, 7.93s | 1.0s, 8.06s | 139ms | 0.05% | 72 |
| 574ms, 6,07s | 1,17s, 14.19s | 1.89s, 15.37s | 201ms | 0 | 91 | |
| 291ms, 5.88s | 415.5ms, 6.45s | 922ms, 11.3s | 143ms | 0 | 78 | |
| VES with Cambria | 50th percentile | 95th percentile | 99th percentile | |||
| 50RPS → 10min | 118ms, 520ms | 174ms, 2.10s | 571ms, 6.48s | 90ms | 0 | 48 |
| 122ms, 548ms | 230ms, 5.17s | 581ms, 5.54s | 88ms | 0 | 32 | |
| 123ms, 557ms | 194ms, 2.50s | 676ms, 5.12s | 88ms | 0 | 42 | |
| 100RPS → 10min | 301ms, 5.79s | 772ms, 16.97s | 1.16s, 17.08s | 153ms | 0 | 88 |
| 340ms, 7.13s | 636ms, 17.87s | 1.15s, 18.48s | 149ms | 0 | 76 | |
| 307ms, 8.29s | 506ms, 9.44s | 855ms, 9.78s | 155ms | 0 | 88 | |
Conclusion:
Results of performance tests for both VES collector client implementation (DMaap client and Cambria client) are very similar.
Max CPU usage, Error rate, Average VES processing time, average and max sync processing time(Client → Ves) are almost the same.
In Ves collector with DMaap client(100RPS for 10 min), appeared an error with the connection pool. In that specific case, we had a connection poll set to 16 and we got an error that the connection poll limits have been reached (stack trace in attachment).
We have to handle that kind of error in code.