Architecture
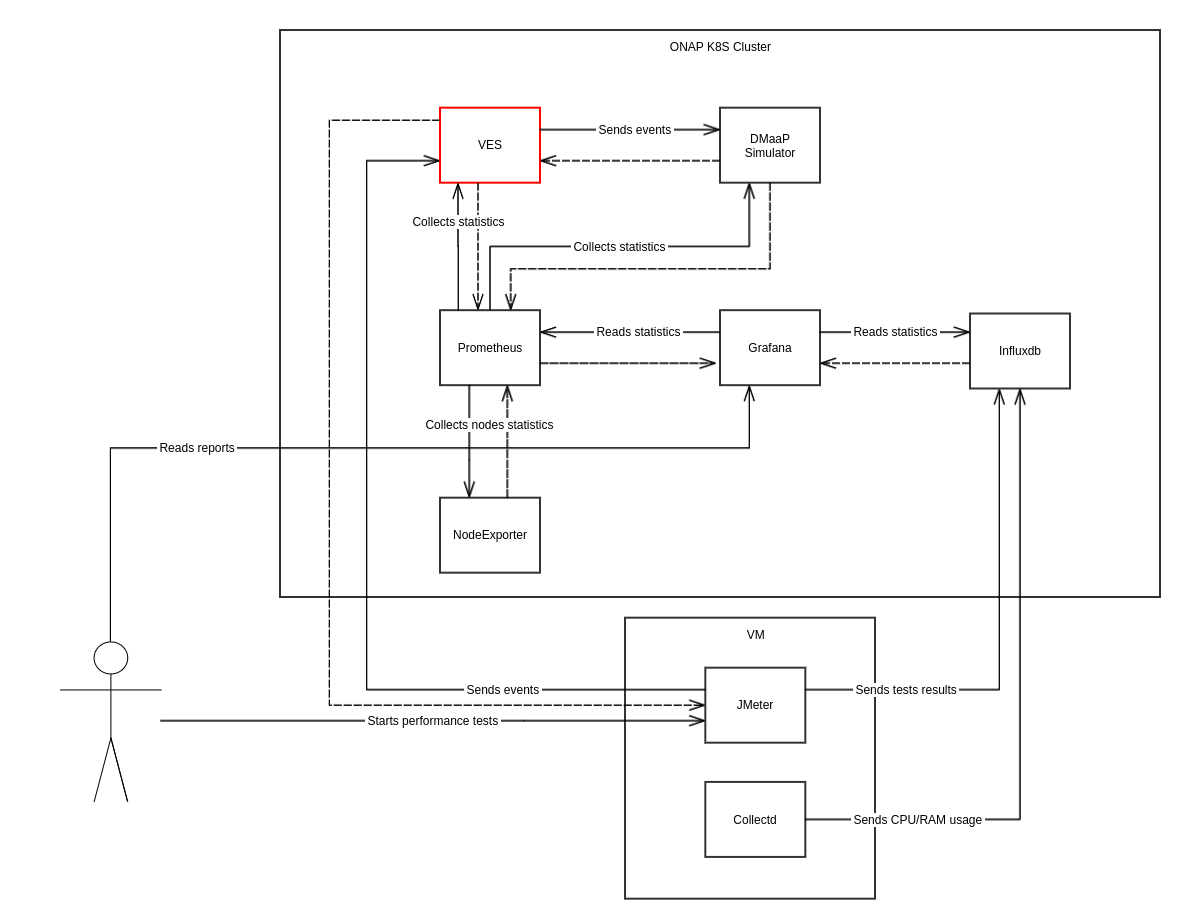
DMaaP Simulator

What is measured
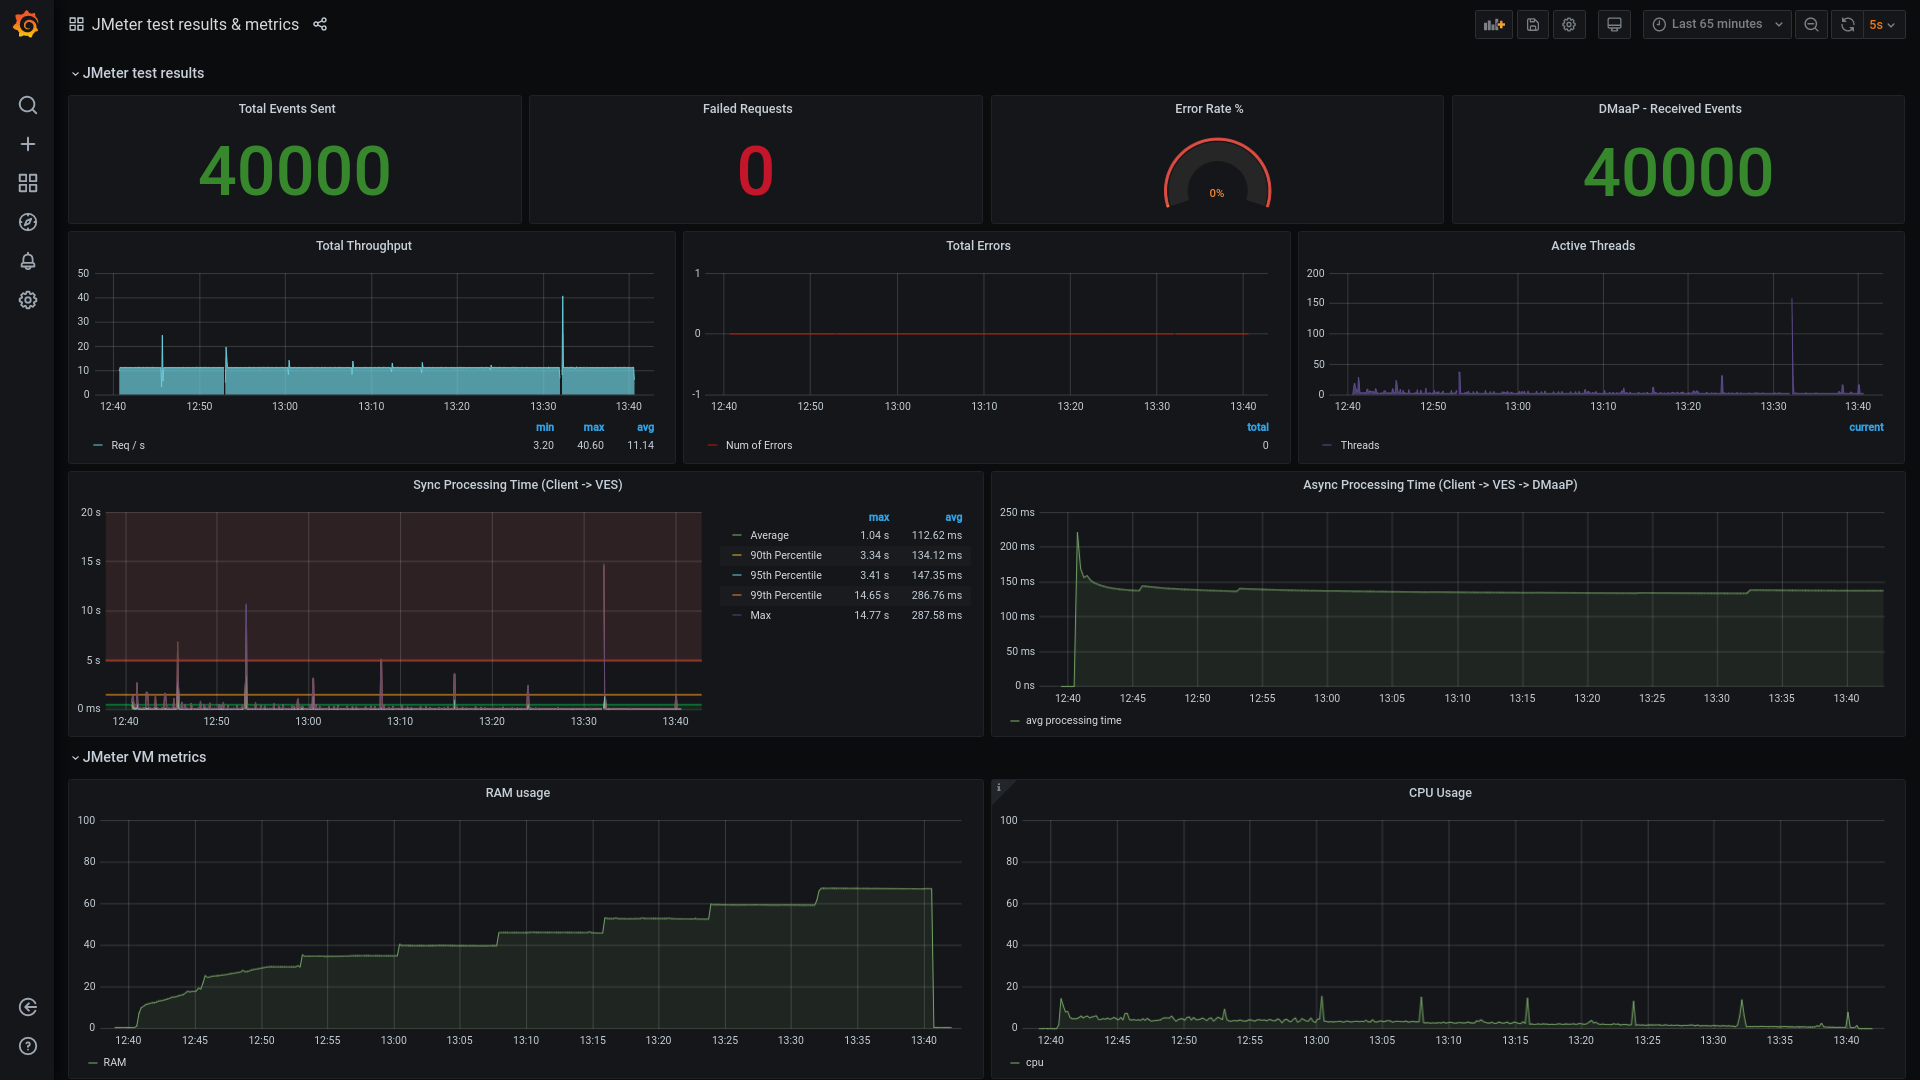
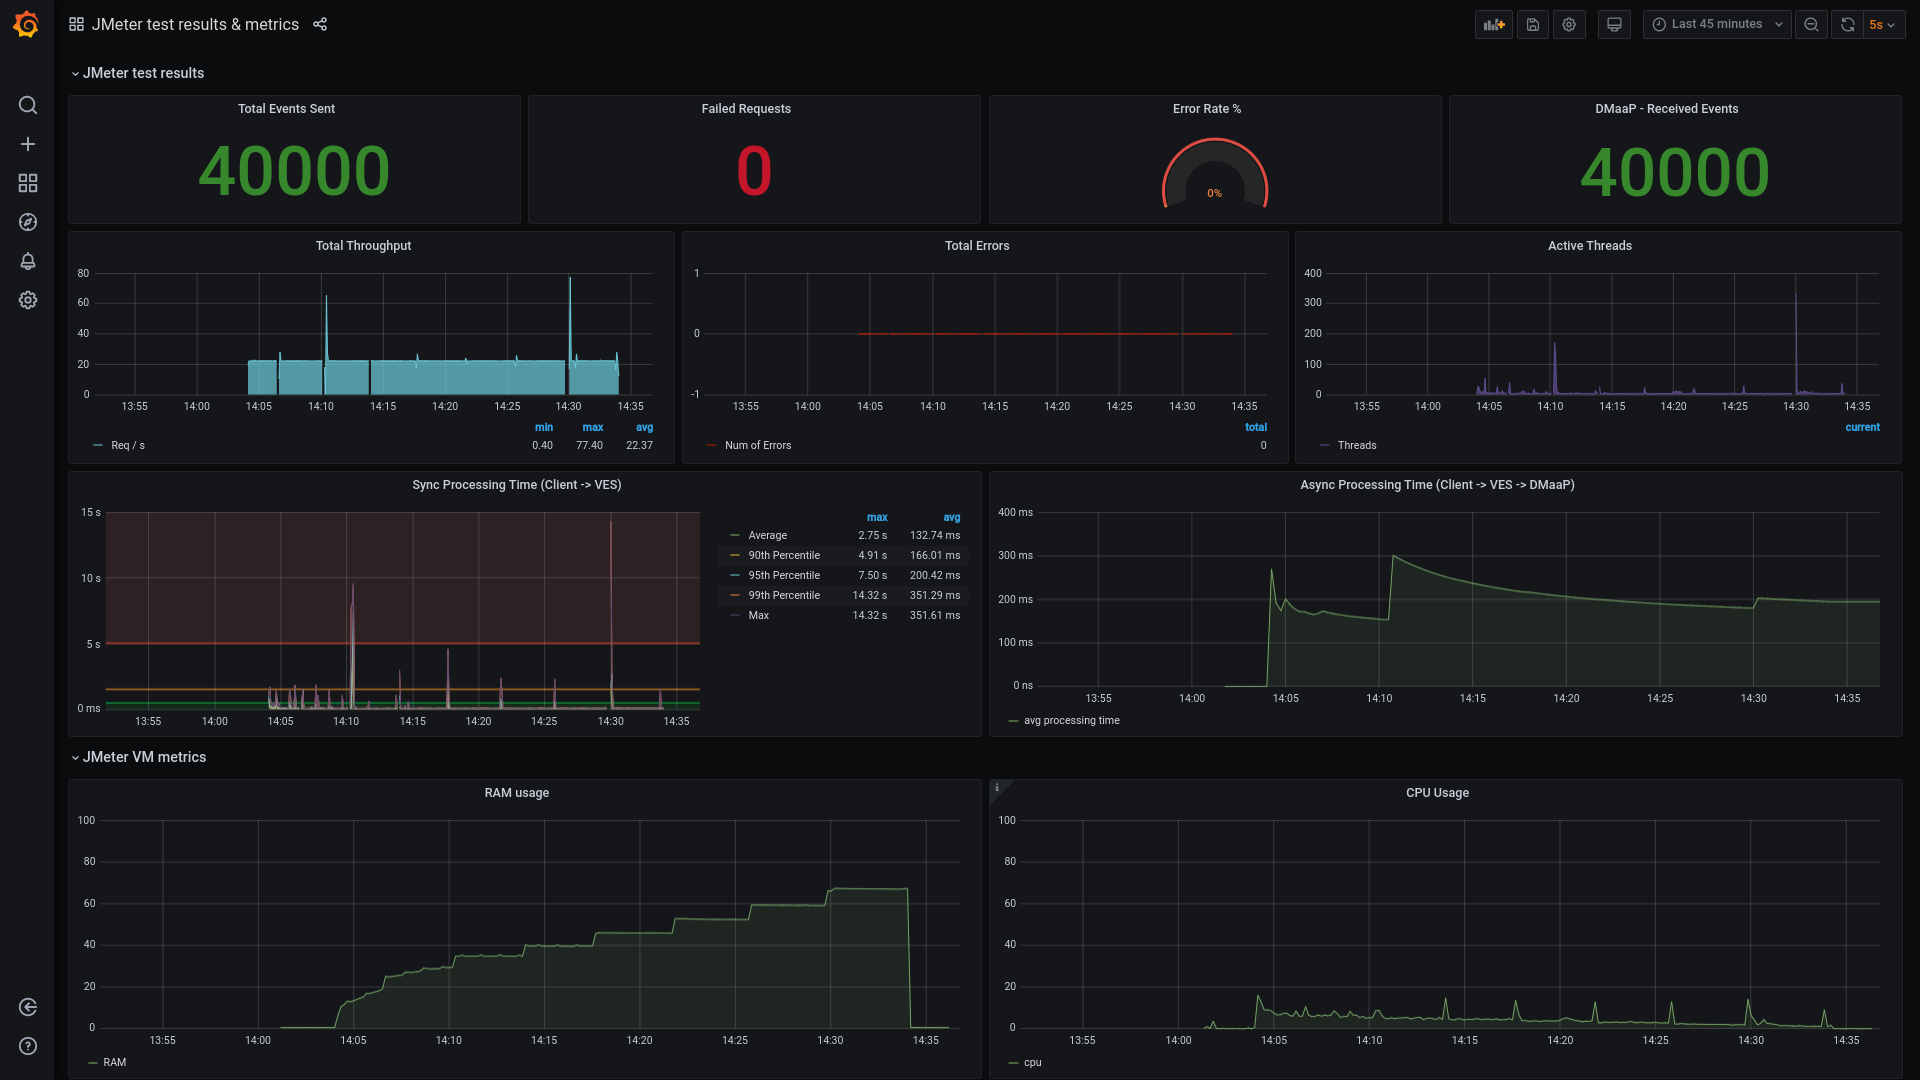
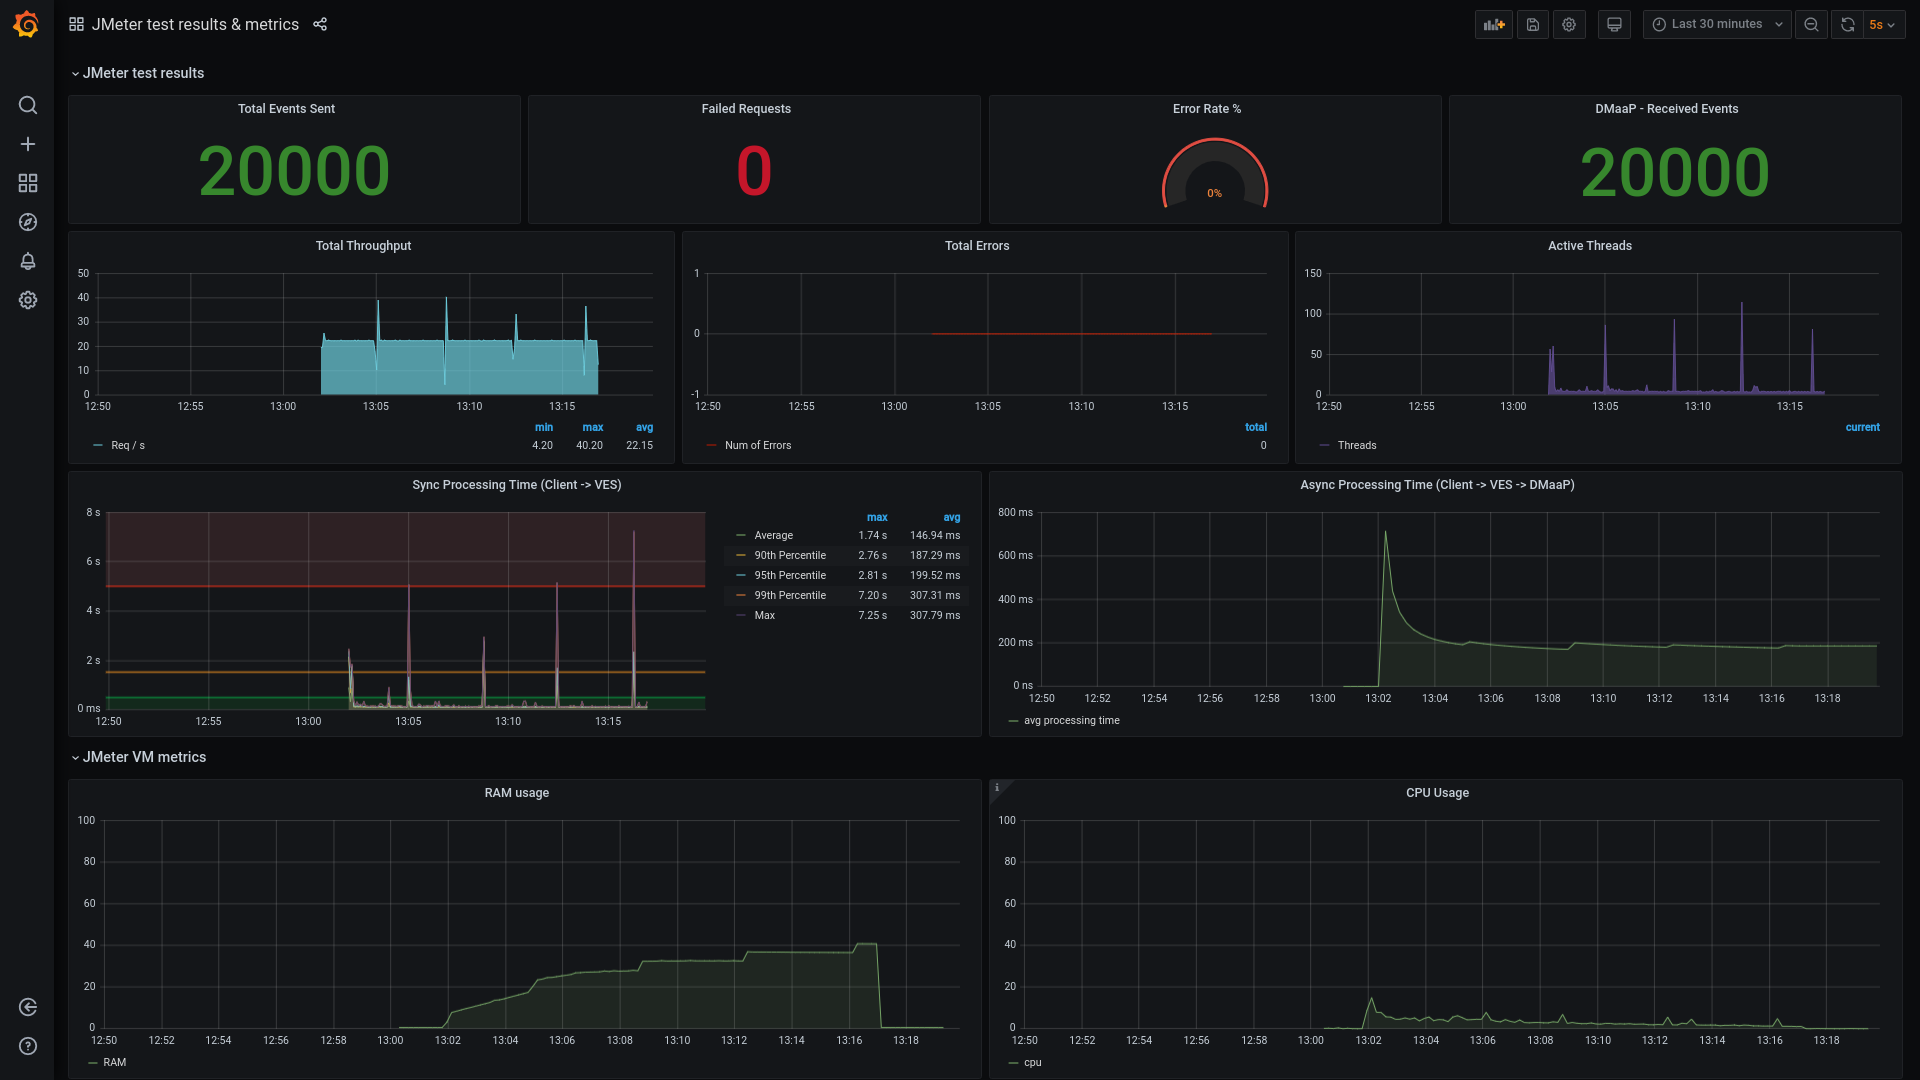
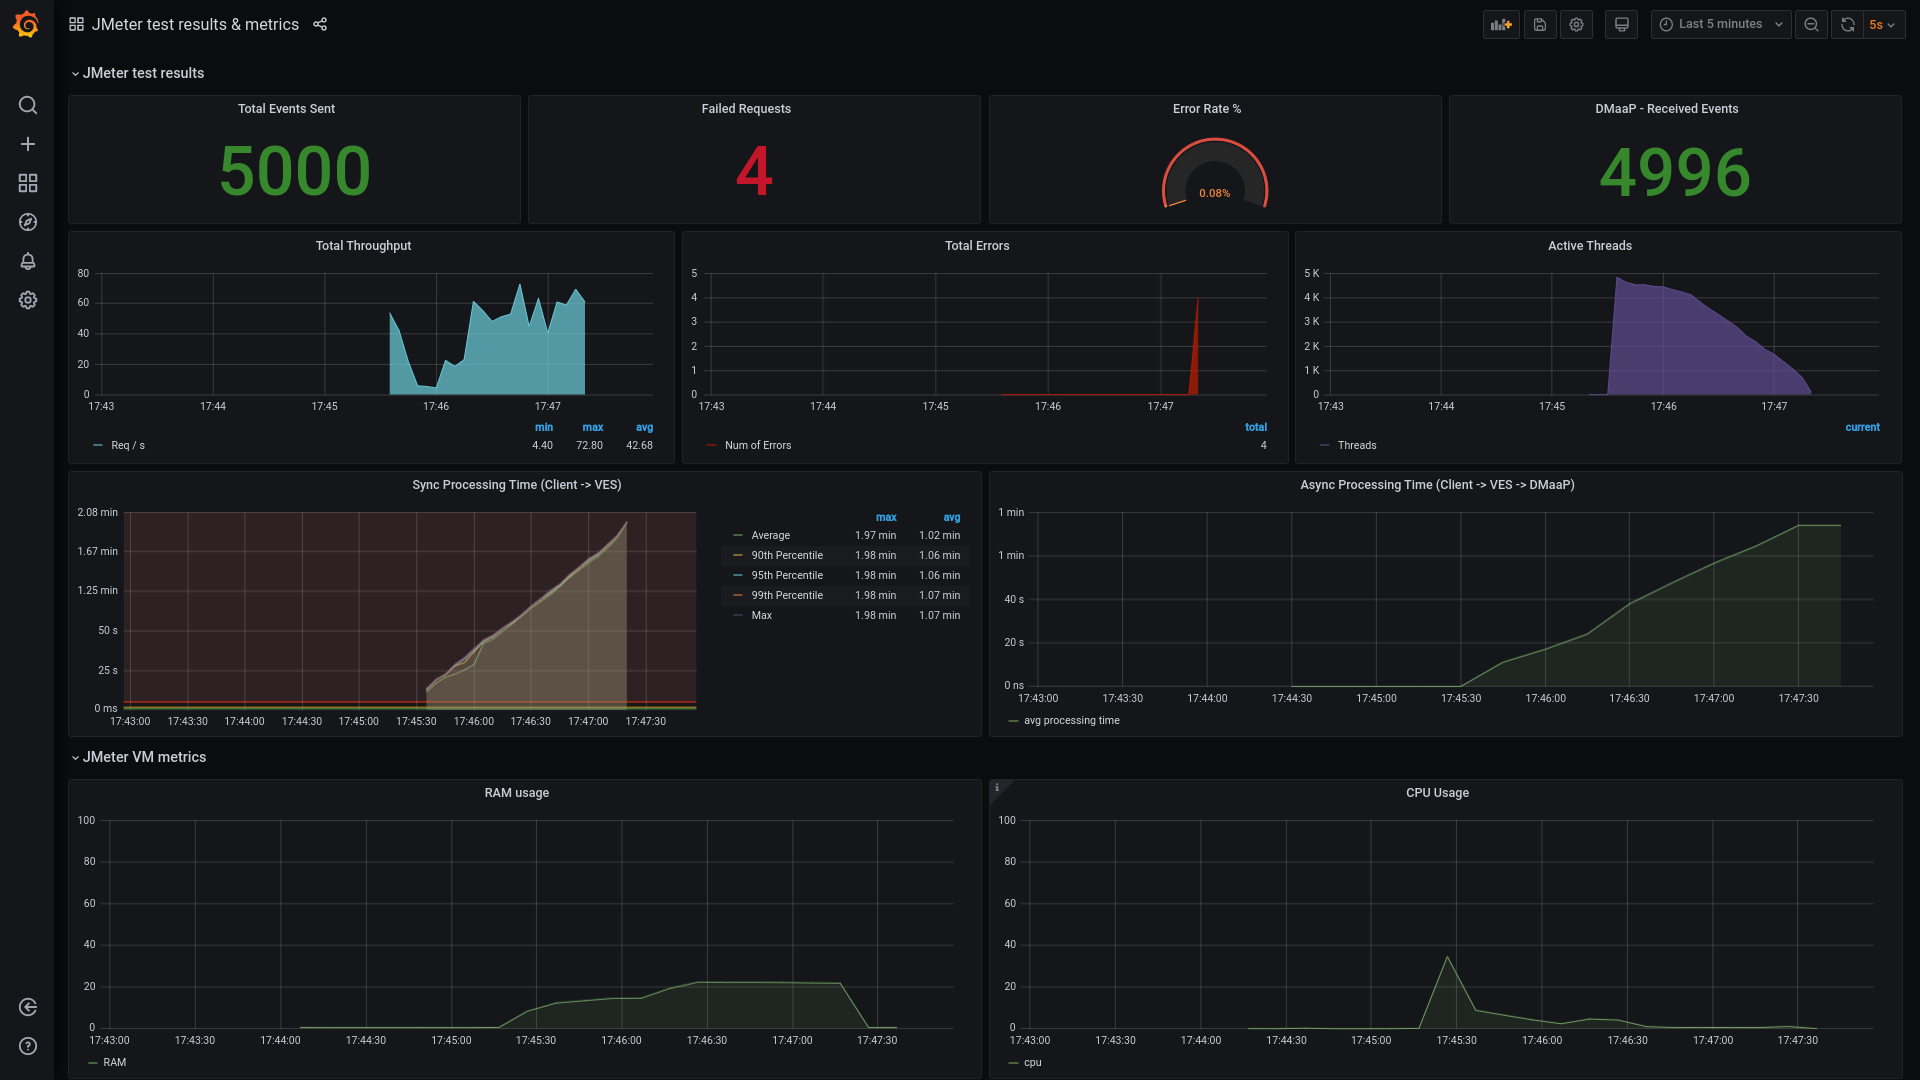
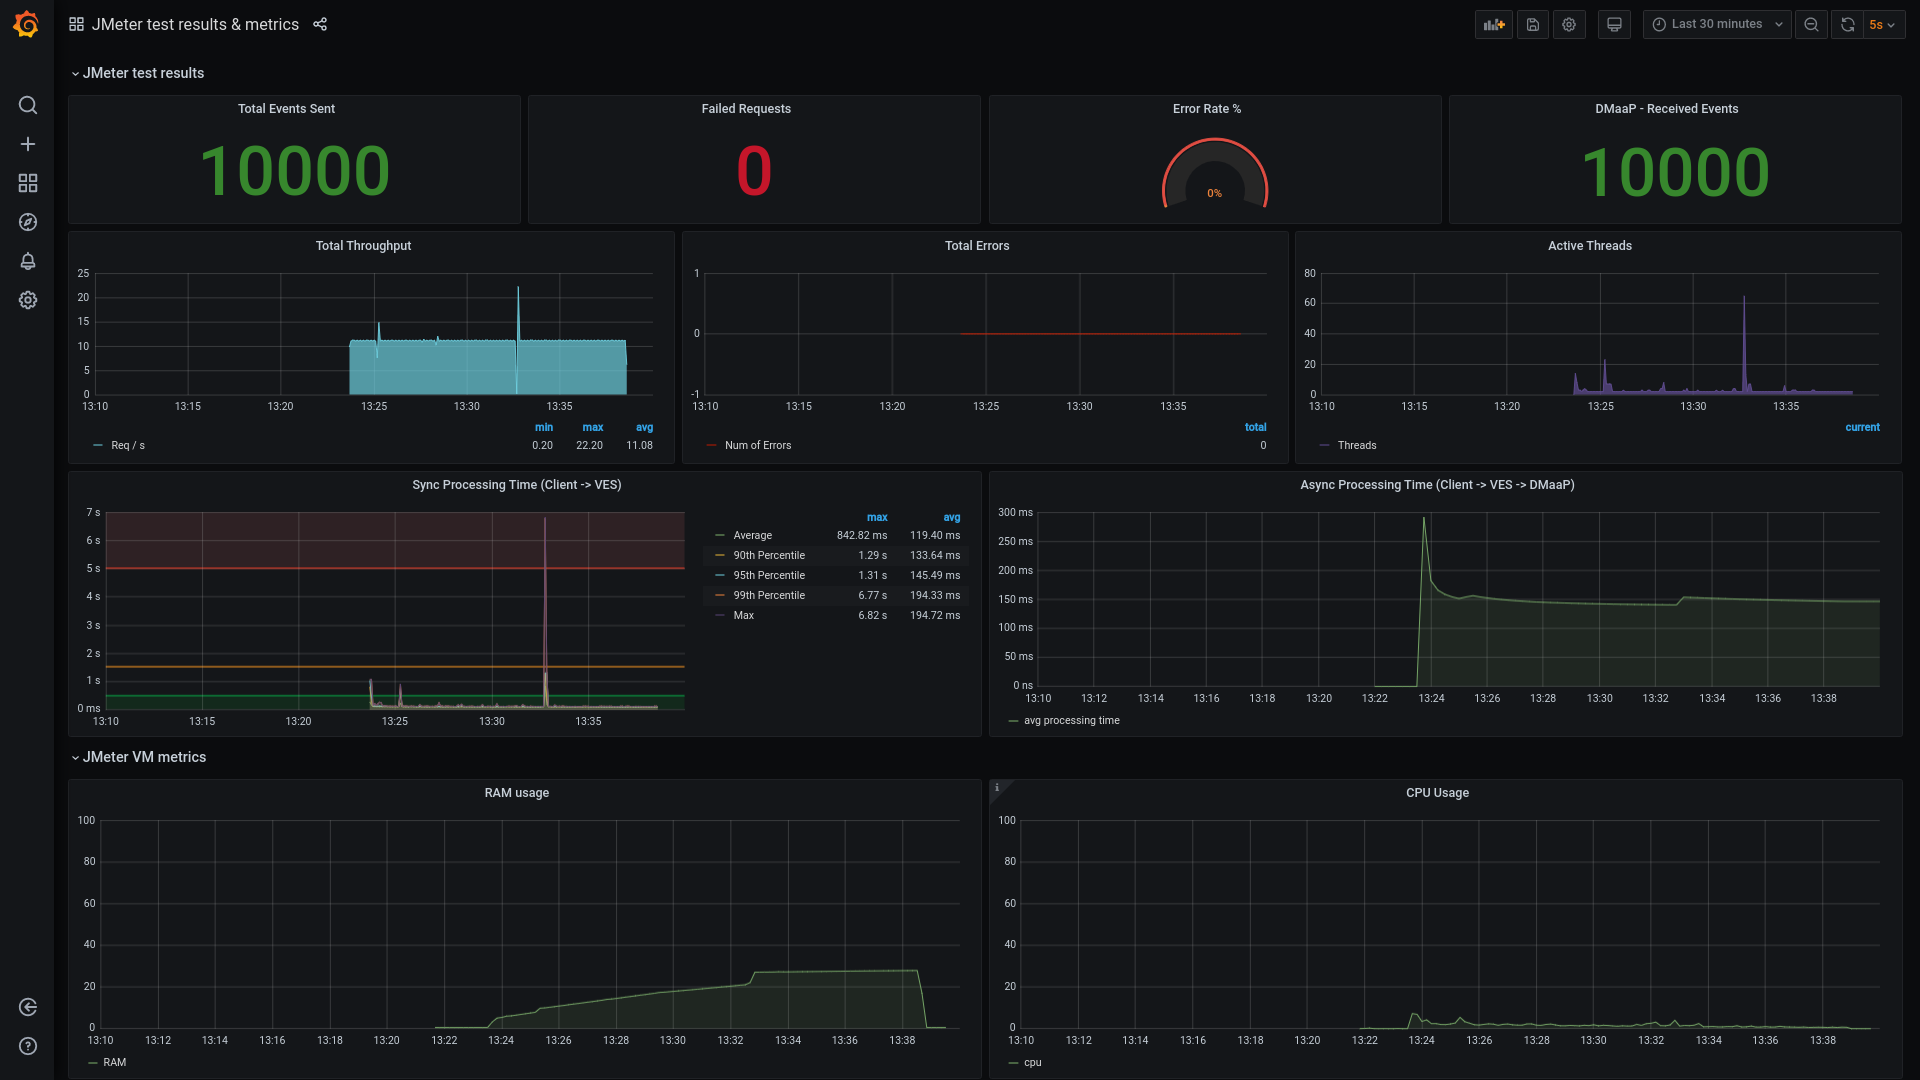
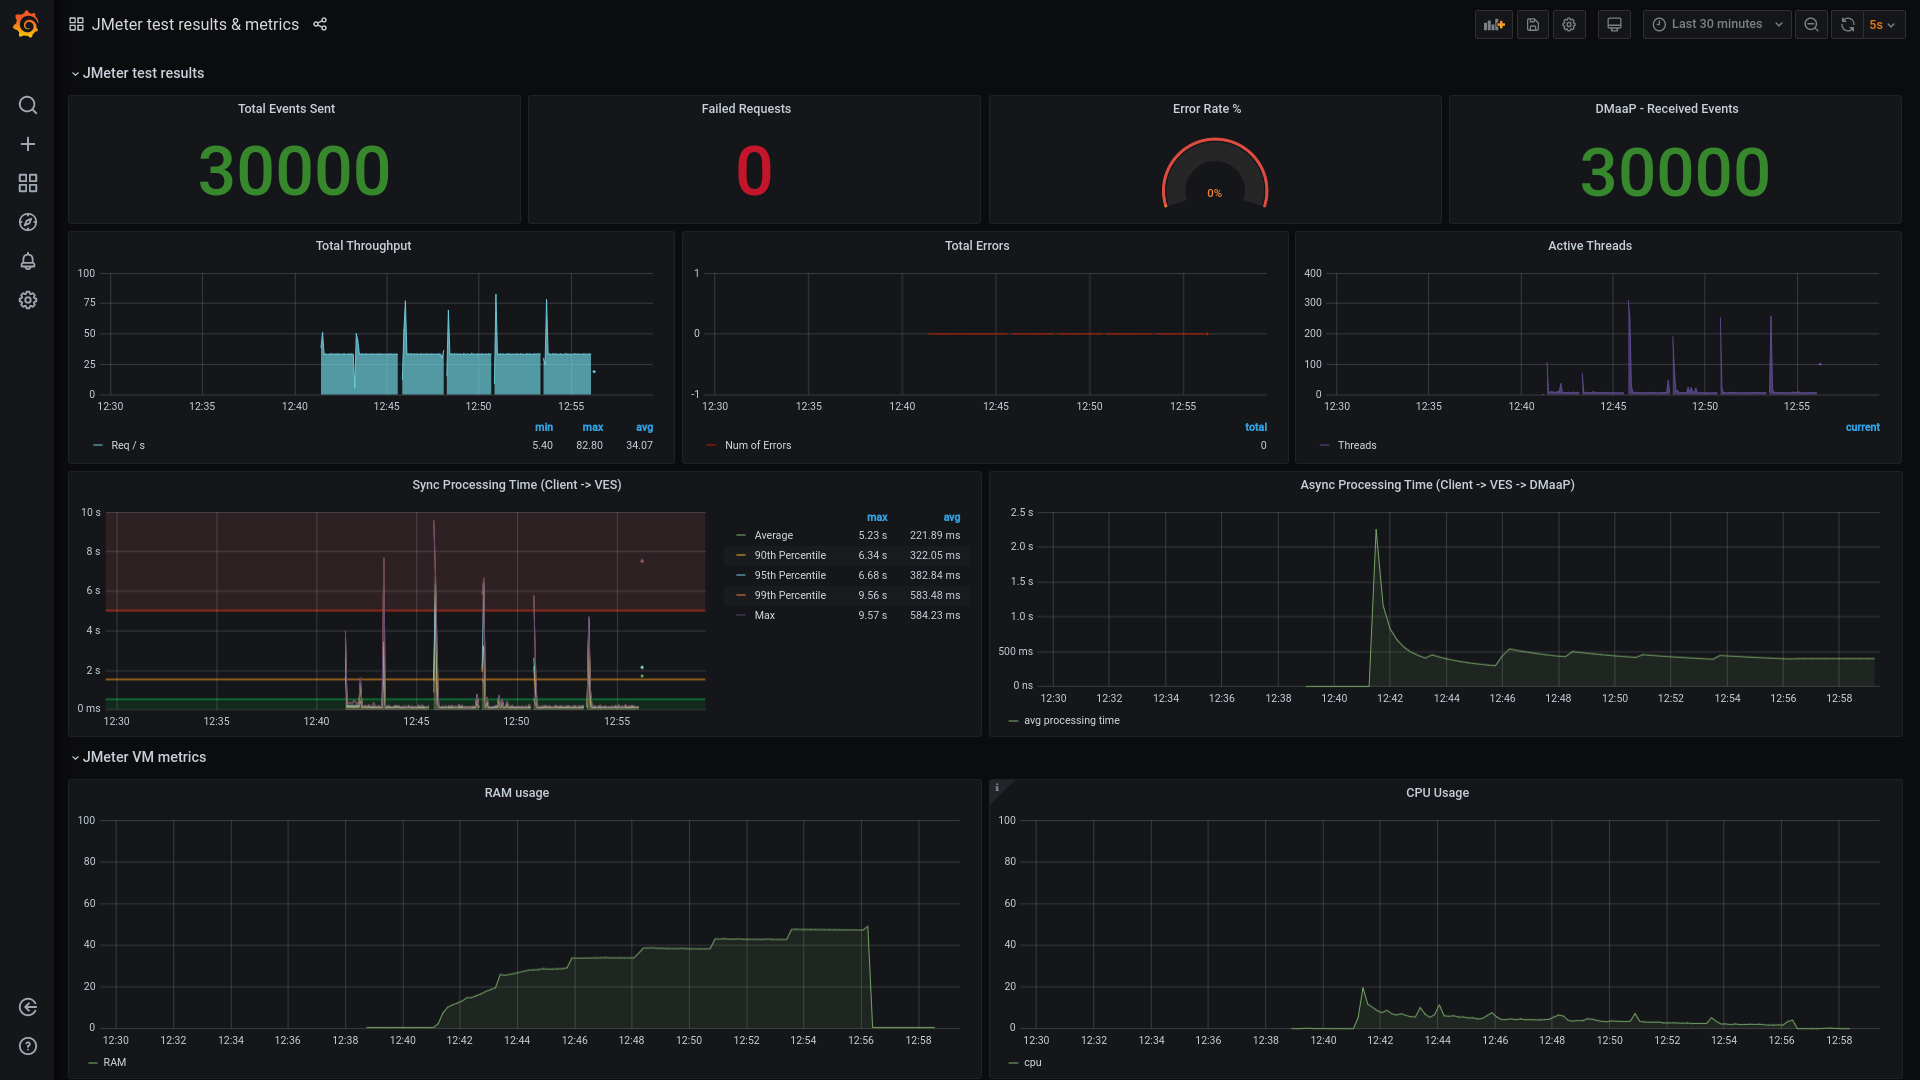
JMeter test results & metrics
- Total Events Sent - total number of events sent by JMeter (including failed requests)
- Failed Requests - total number of failed requests
- Error Rate % - 'Failed Requests' to 'Total Events Sent' ratio in percentages
- DMaaP - Received Events - total number of events received by DMaaP on Fault topic
- Total Throughput - number of events sent per second by JMeter
- Total Errors - failed requests per second
- Active Threads - number of active threads per second
- Sync Processing Time (Client → VES) - time measured from sending the request by JMeter to receiving the response by JMeter
- Async Processing Time (Client → VES → DMaaP) - time measured from sending the request by JMeter to receiving the event by DMaaP
- RAM Usage - RAM usage of JMeter VM
- CPU Usage - CPU usage of JMeter VM
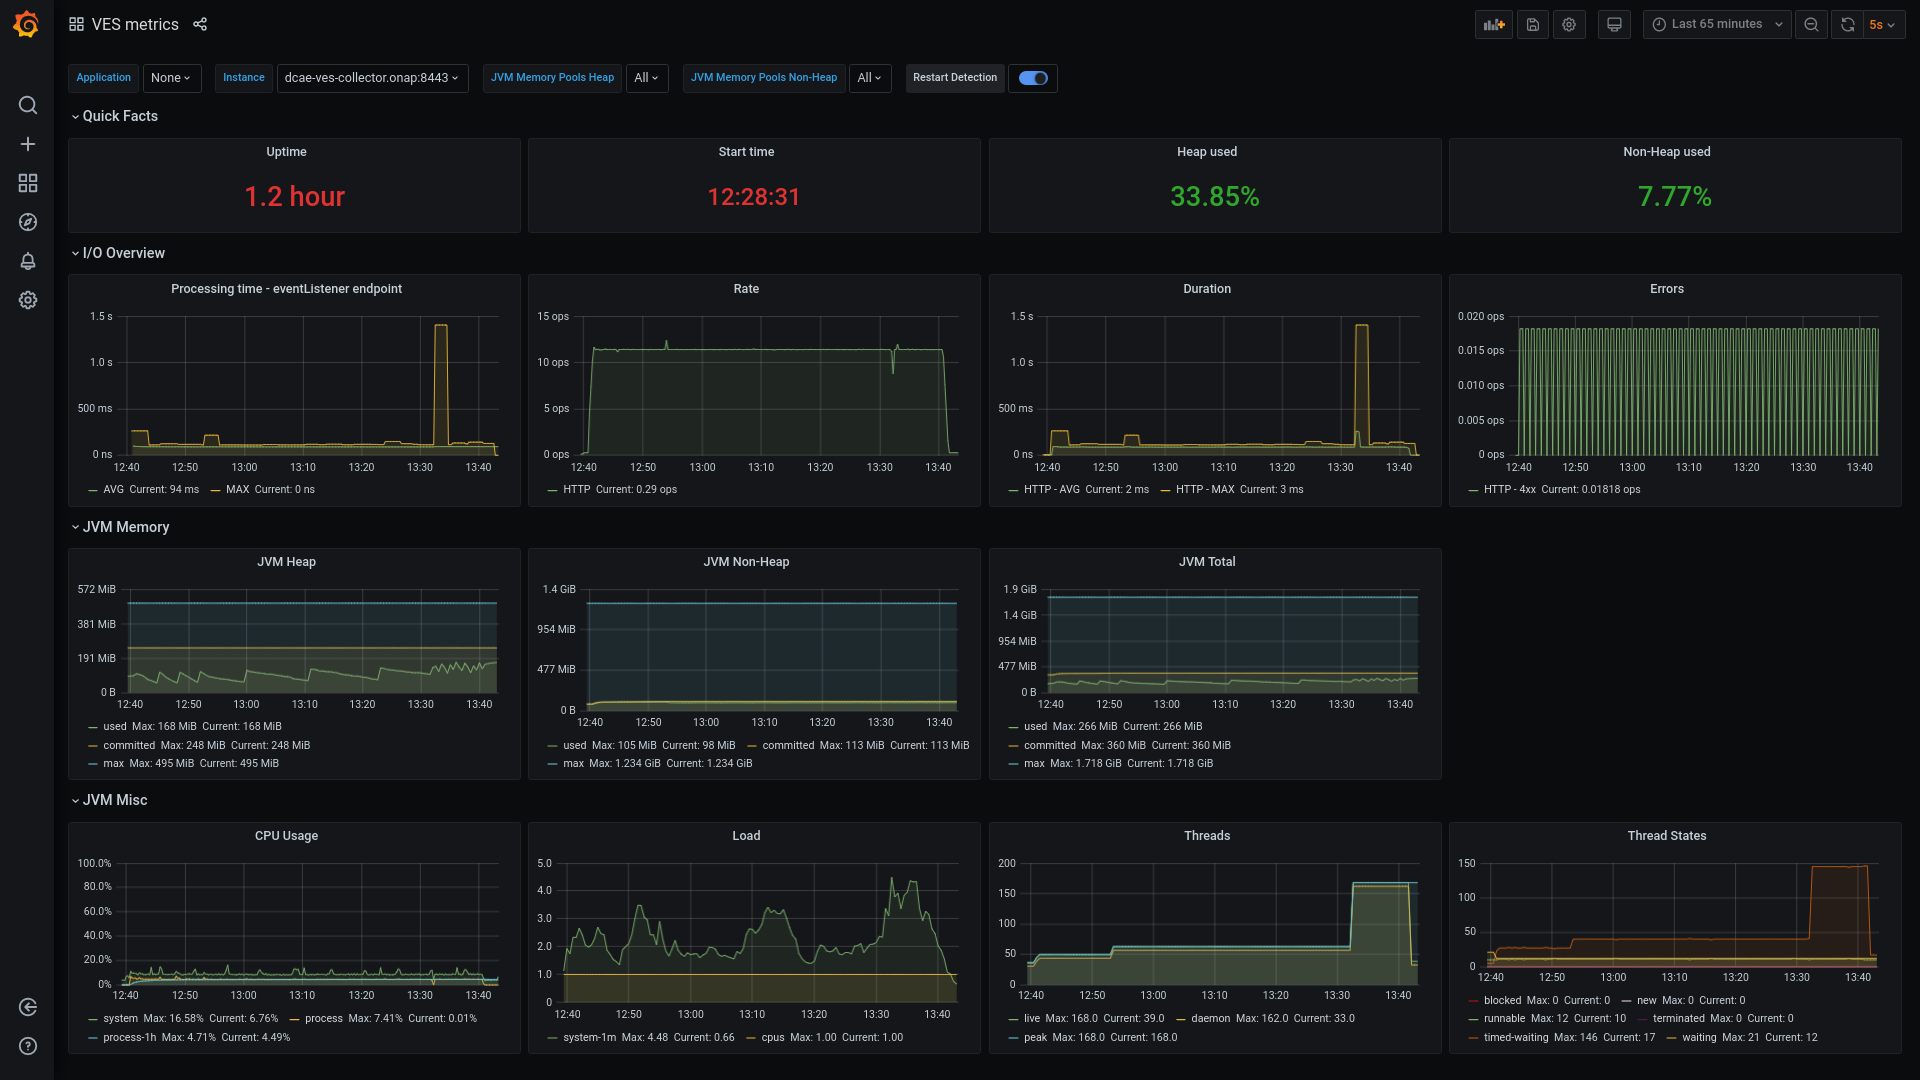
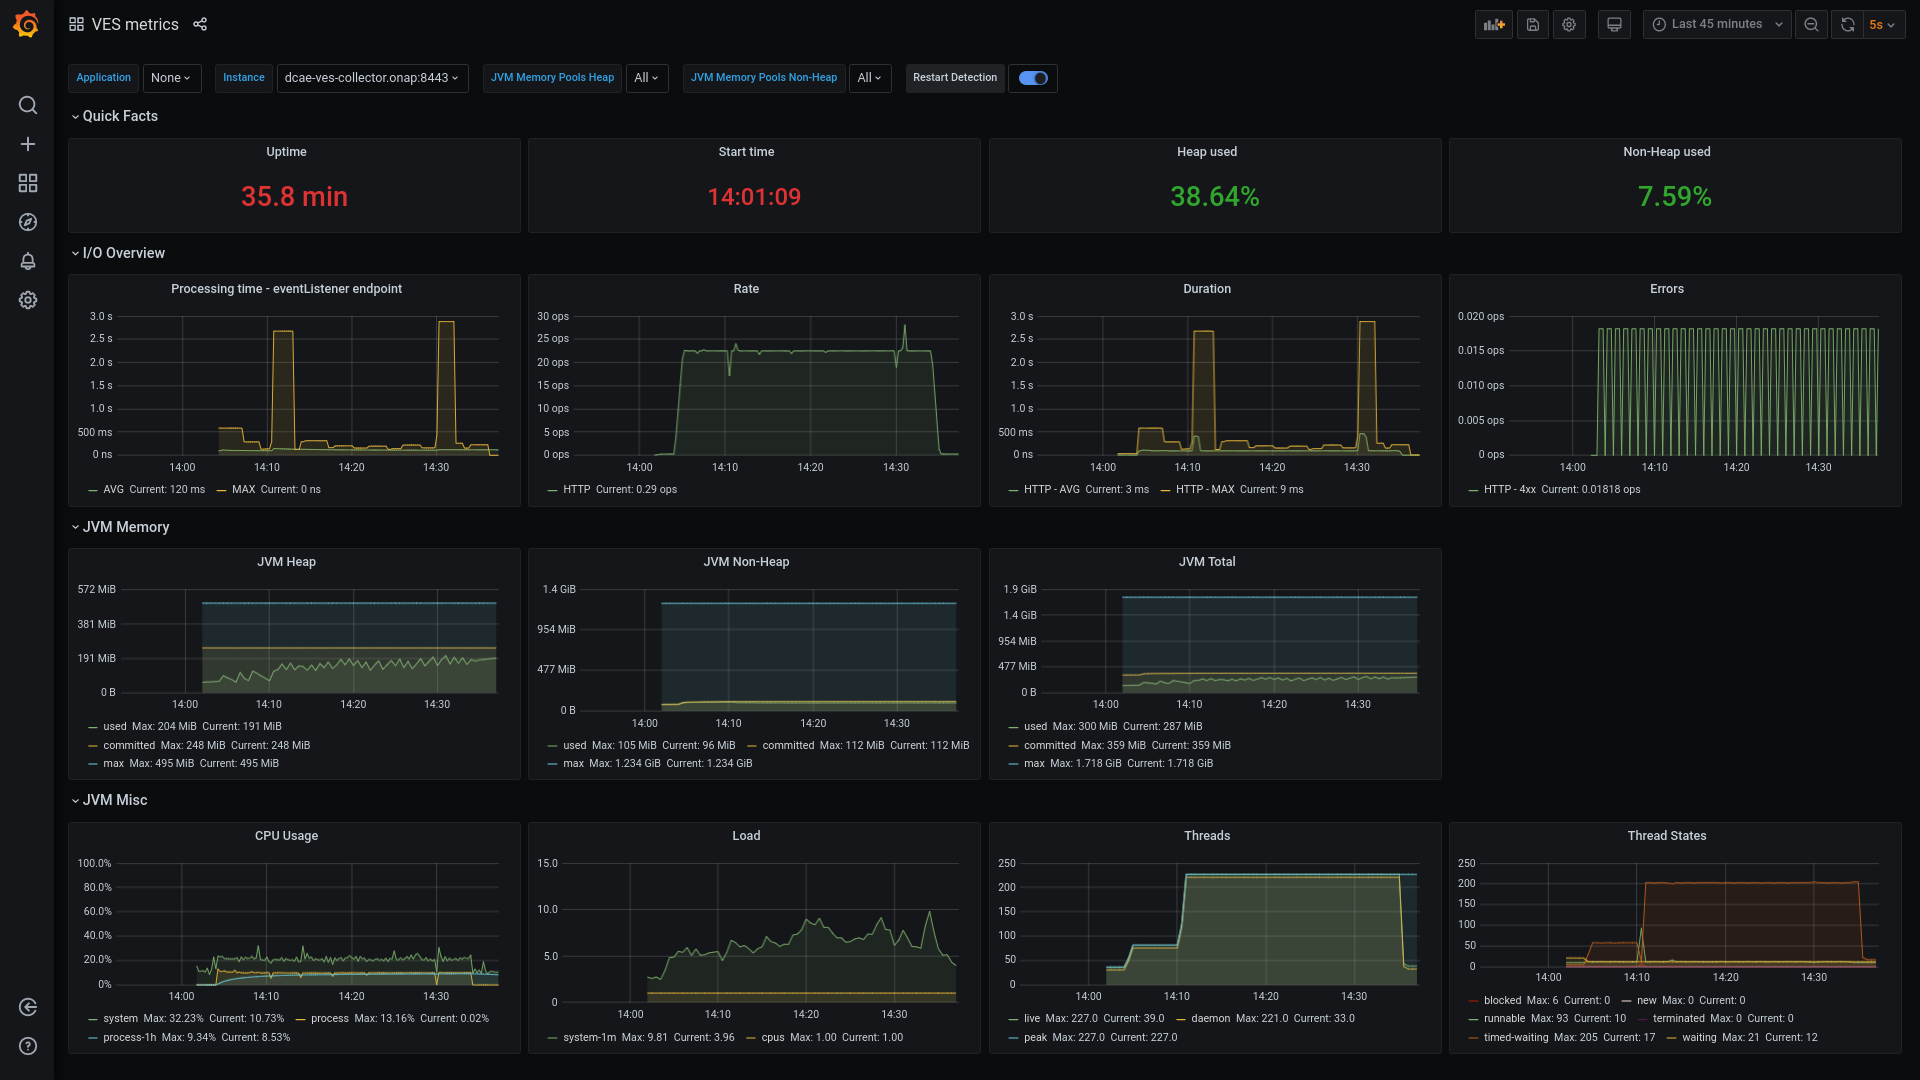
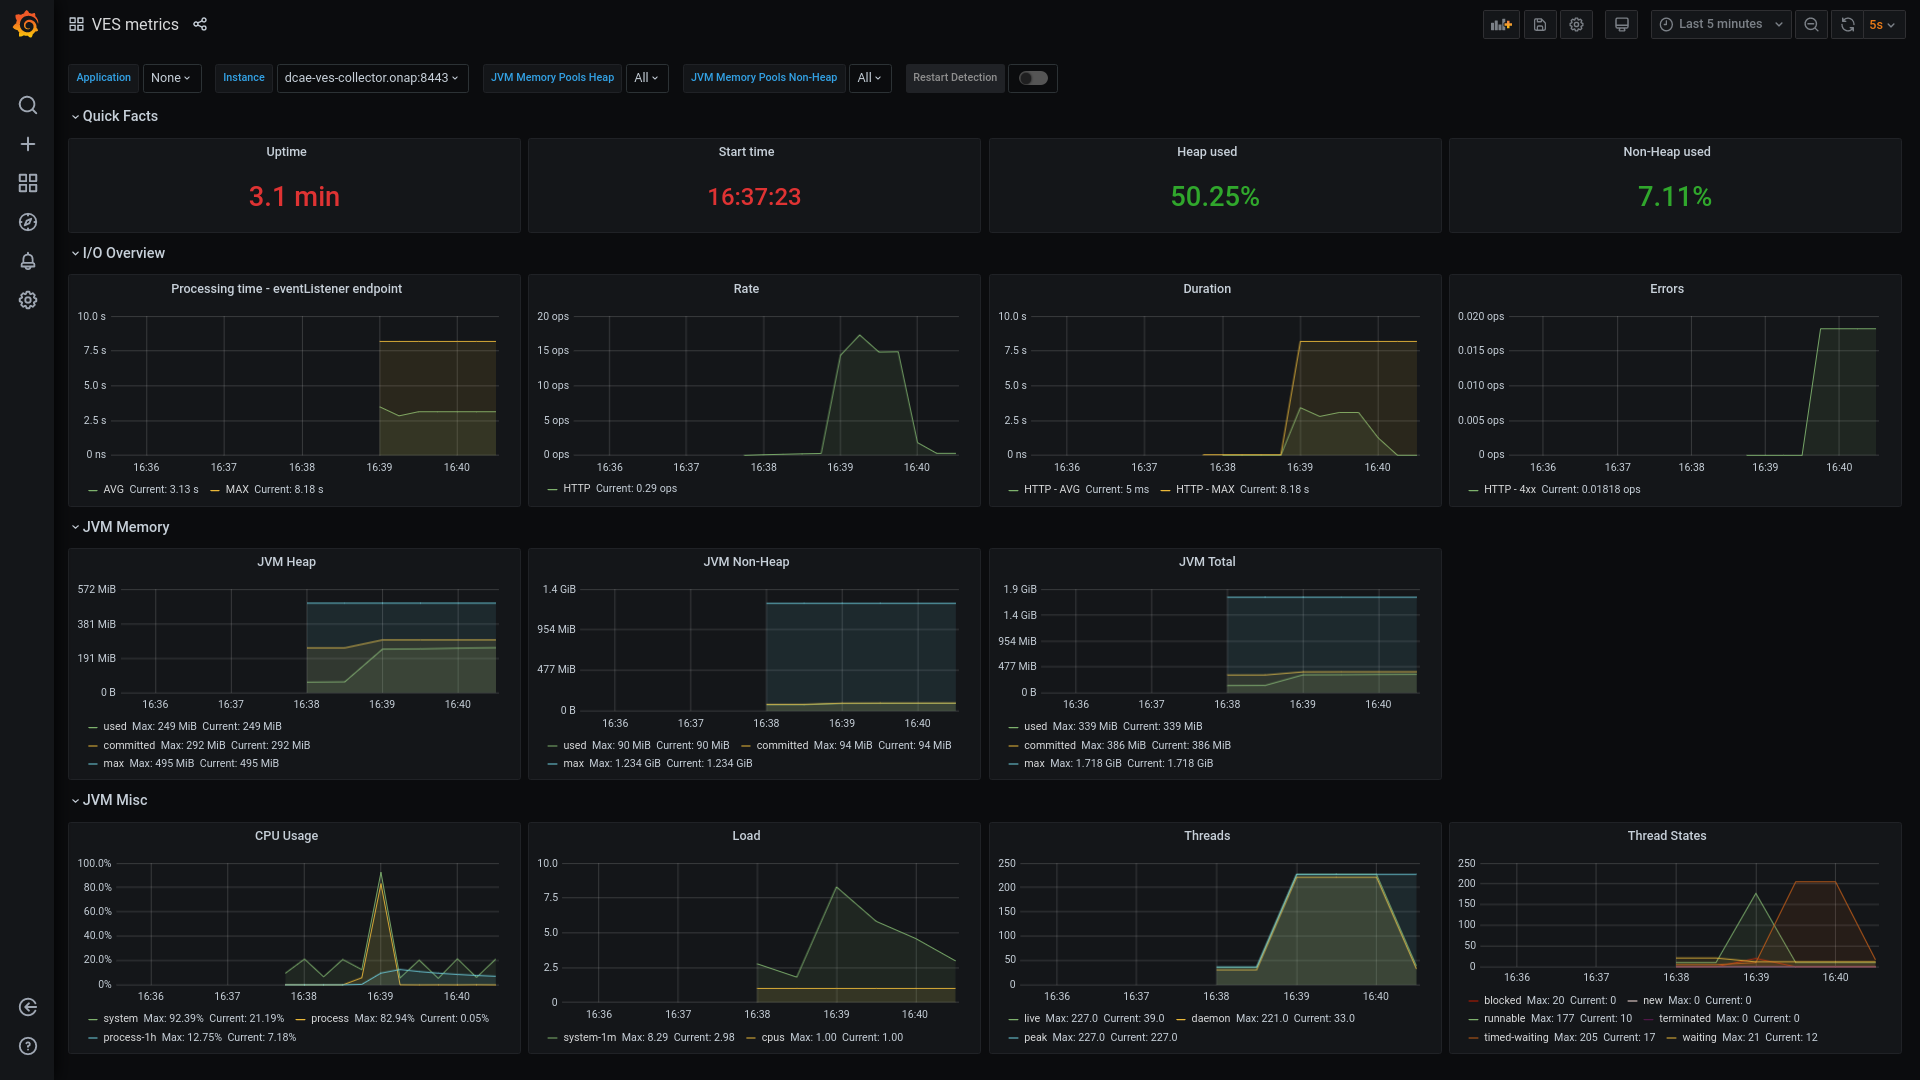
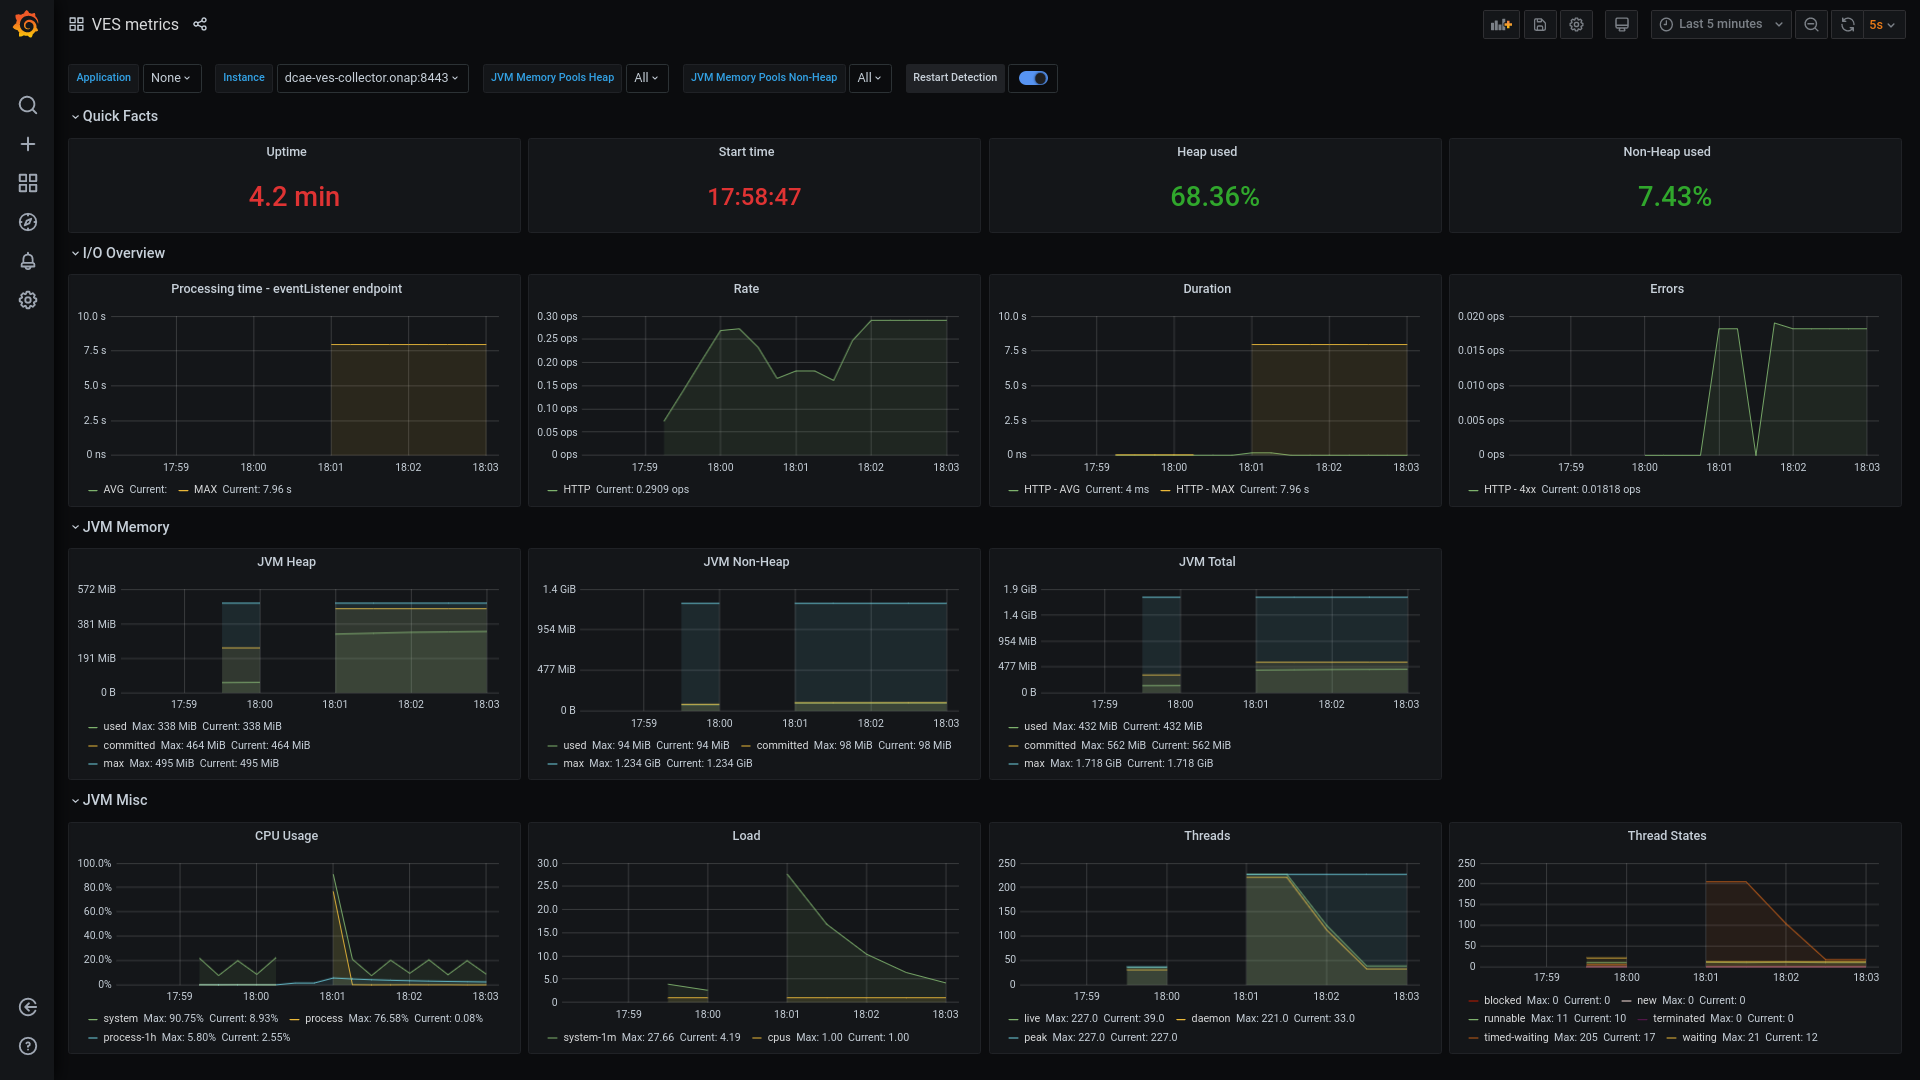
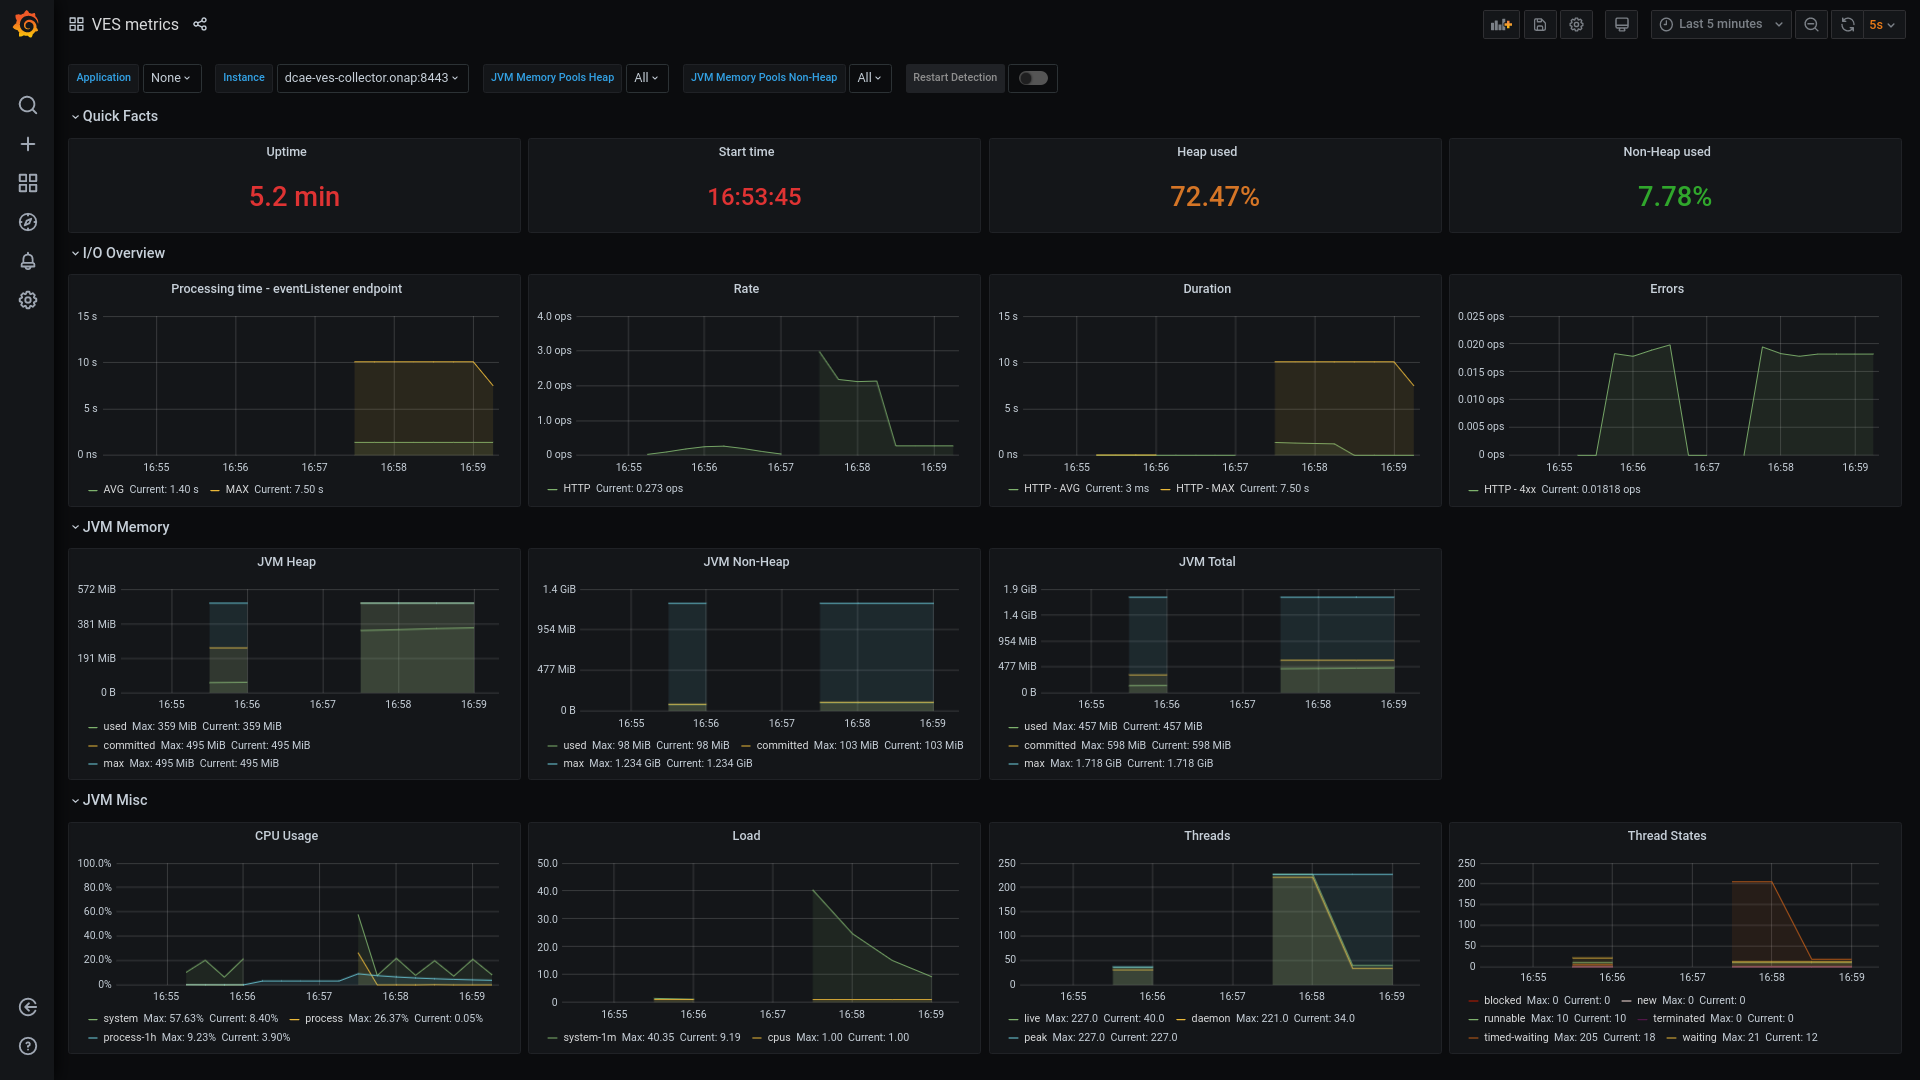
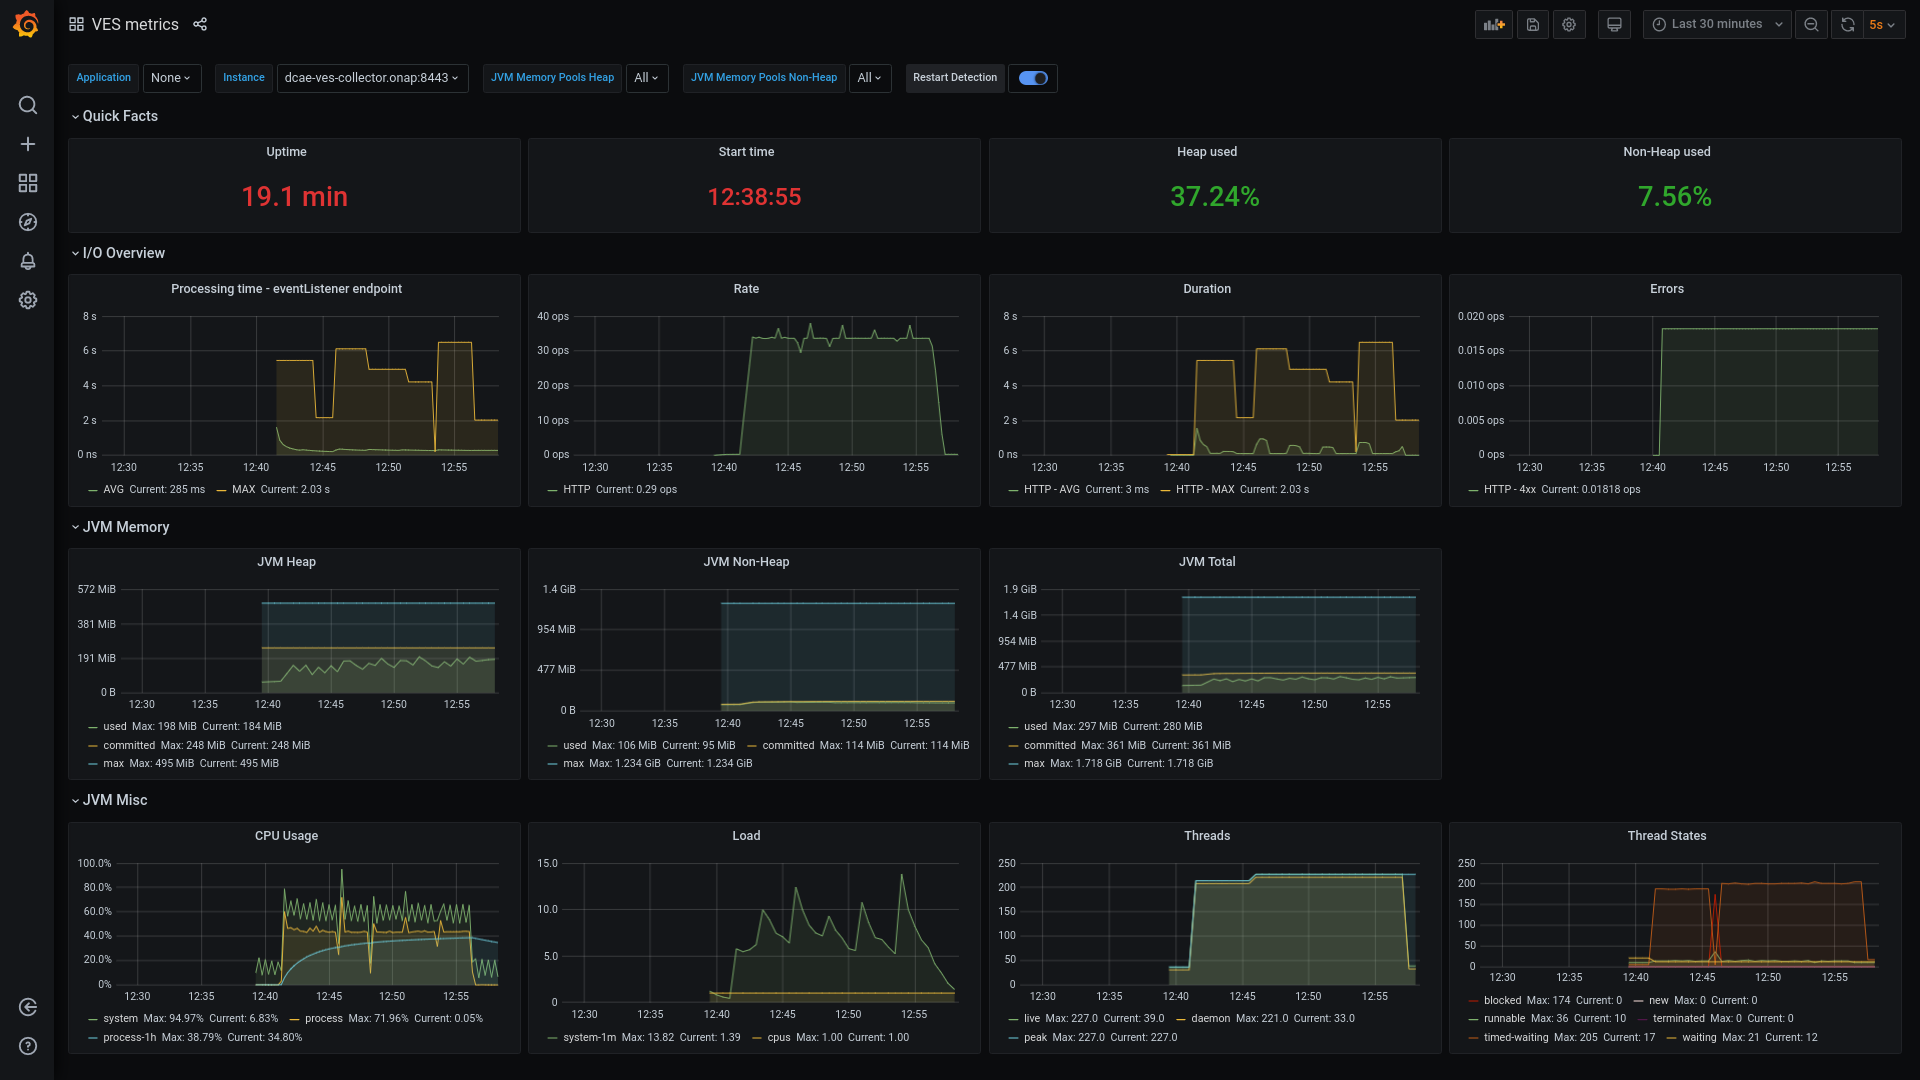
Ves metrics
- Uptime - how long VES is running
- Start time - when VES has been started
- Heap used - current Heap usage in percentages
- Non-Heap used - current Non-Heap usage in percentages
- Processing time eventListener endpoint - method execution time in VES
- Rate - number of HTTP requests per second
- Duration - maximum and average HTTP request processing time (HTTP request other than 5xx) in milliseconds
- Errors - number of 4xx and 5xx requests per second
- JVM Heap - JVM Heap usage
- used - the amount of used memory
- committed - the amount of memory in bytes that is committed for the Java virtual machine to use
- max - the maximum amount of memory in bytes that can be used for memory management
- JVM Non-Heap - JVM Non-Heap usage
- used, committed, max as in JVM Heap
- JVM Total - JVM Heap + JVM Non-Heap
- used, committed, max as in JVM Heap
- CPU Usage - VES CPU usage (Note, that VES can use the whole CPU available on the Worker Node)
- system - CPU usage for the whole system
- process - CPU usage for the Java Virtual Machine process
- process-1h - average CPU usage for the Java Virtual Machine process over 1h
- Load
- system-1m - number of runnable entities queued to available processors and the number of runnable entities running on the available processors averaged over a period of time
- cpus - the number of processors available to the Java virtual machine
- Threads
- live - the current number of live threads including both daemon and non-daemon threads
- daemon - the current number of live daemon threads
- peak - the peak live thread count since the Java virtual machine started or peak was reset
- Thread States - The current number of threads depending on the state
- runnable
- blocked
- waiting
- timed-waiting
- new
- terminated
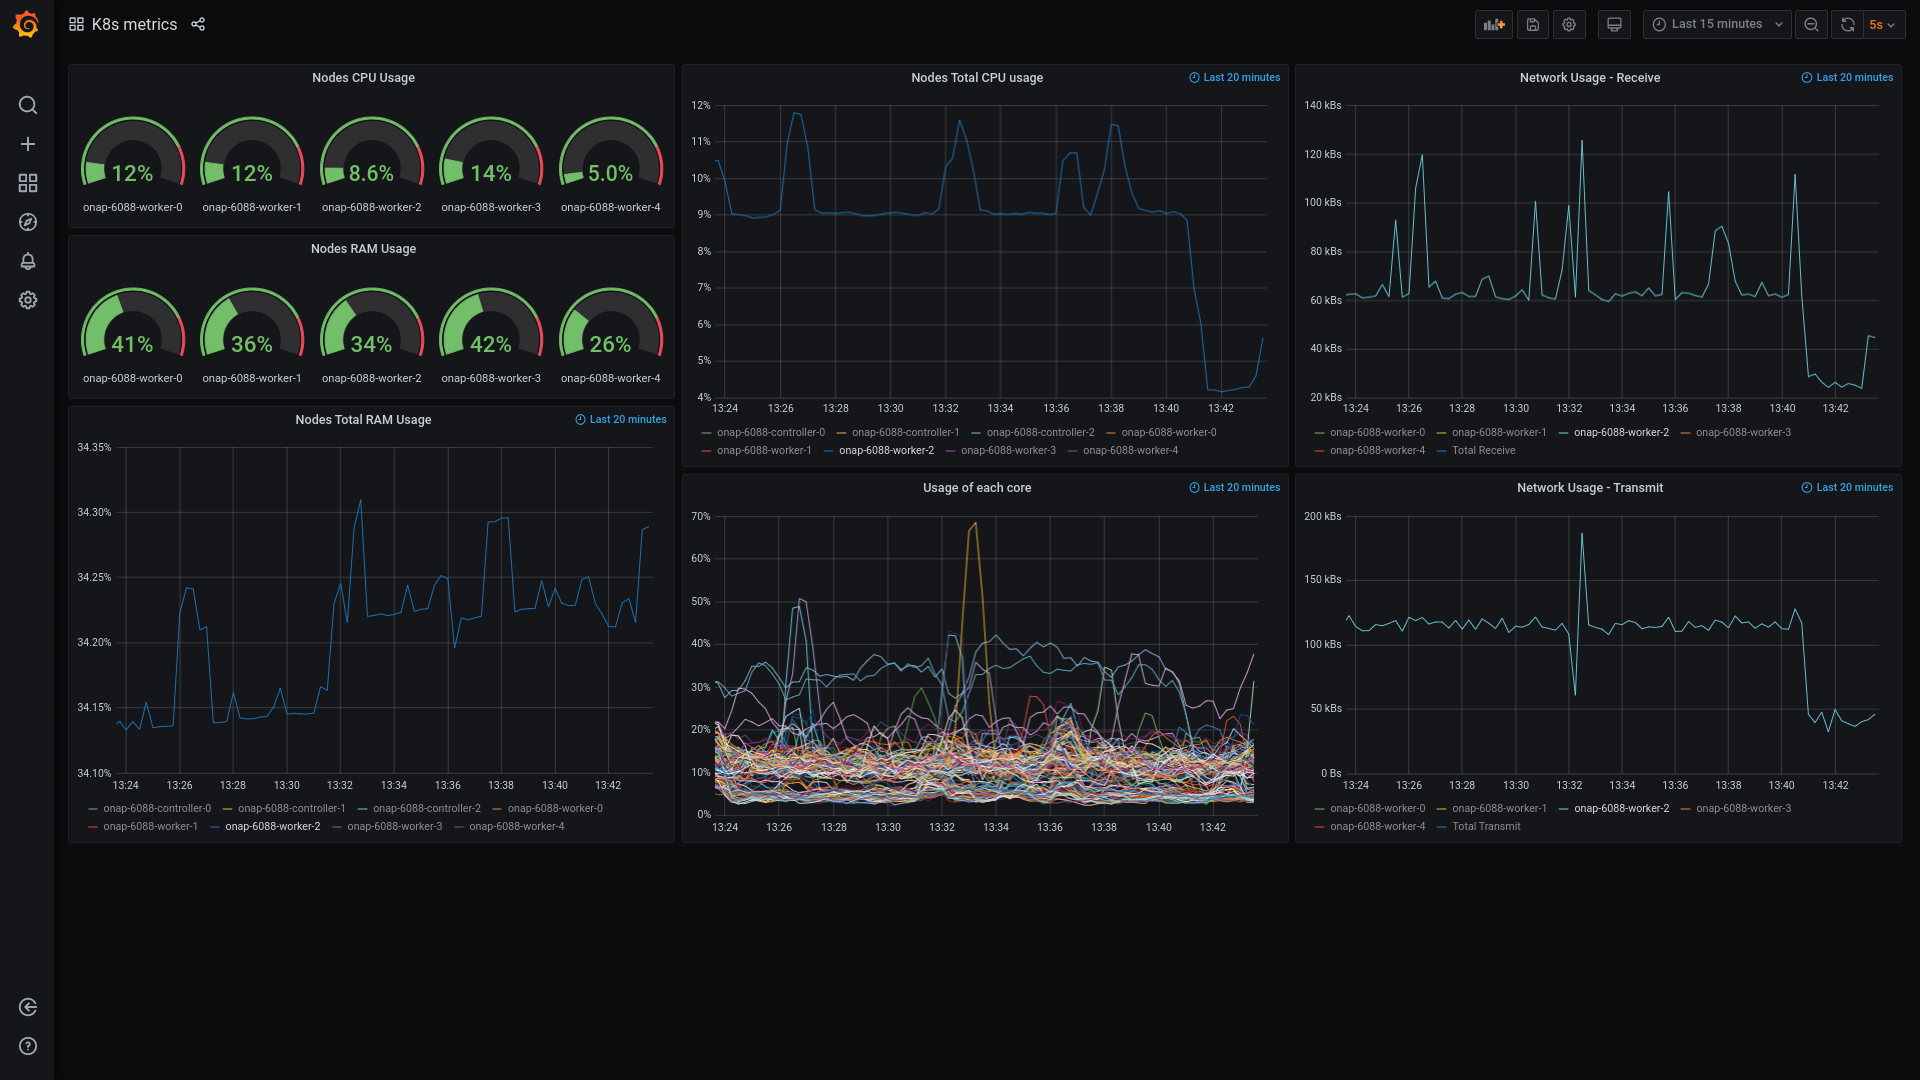
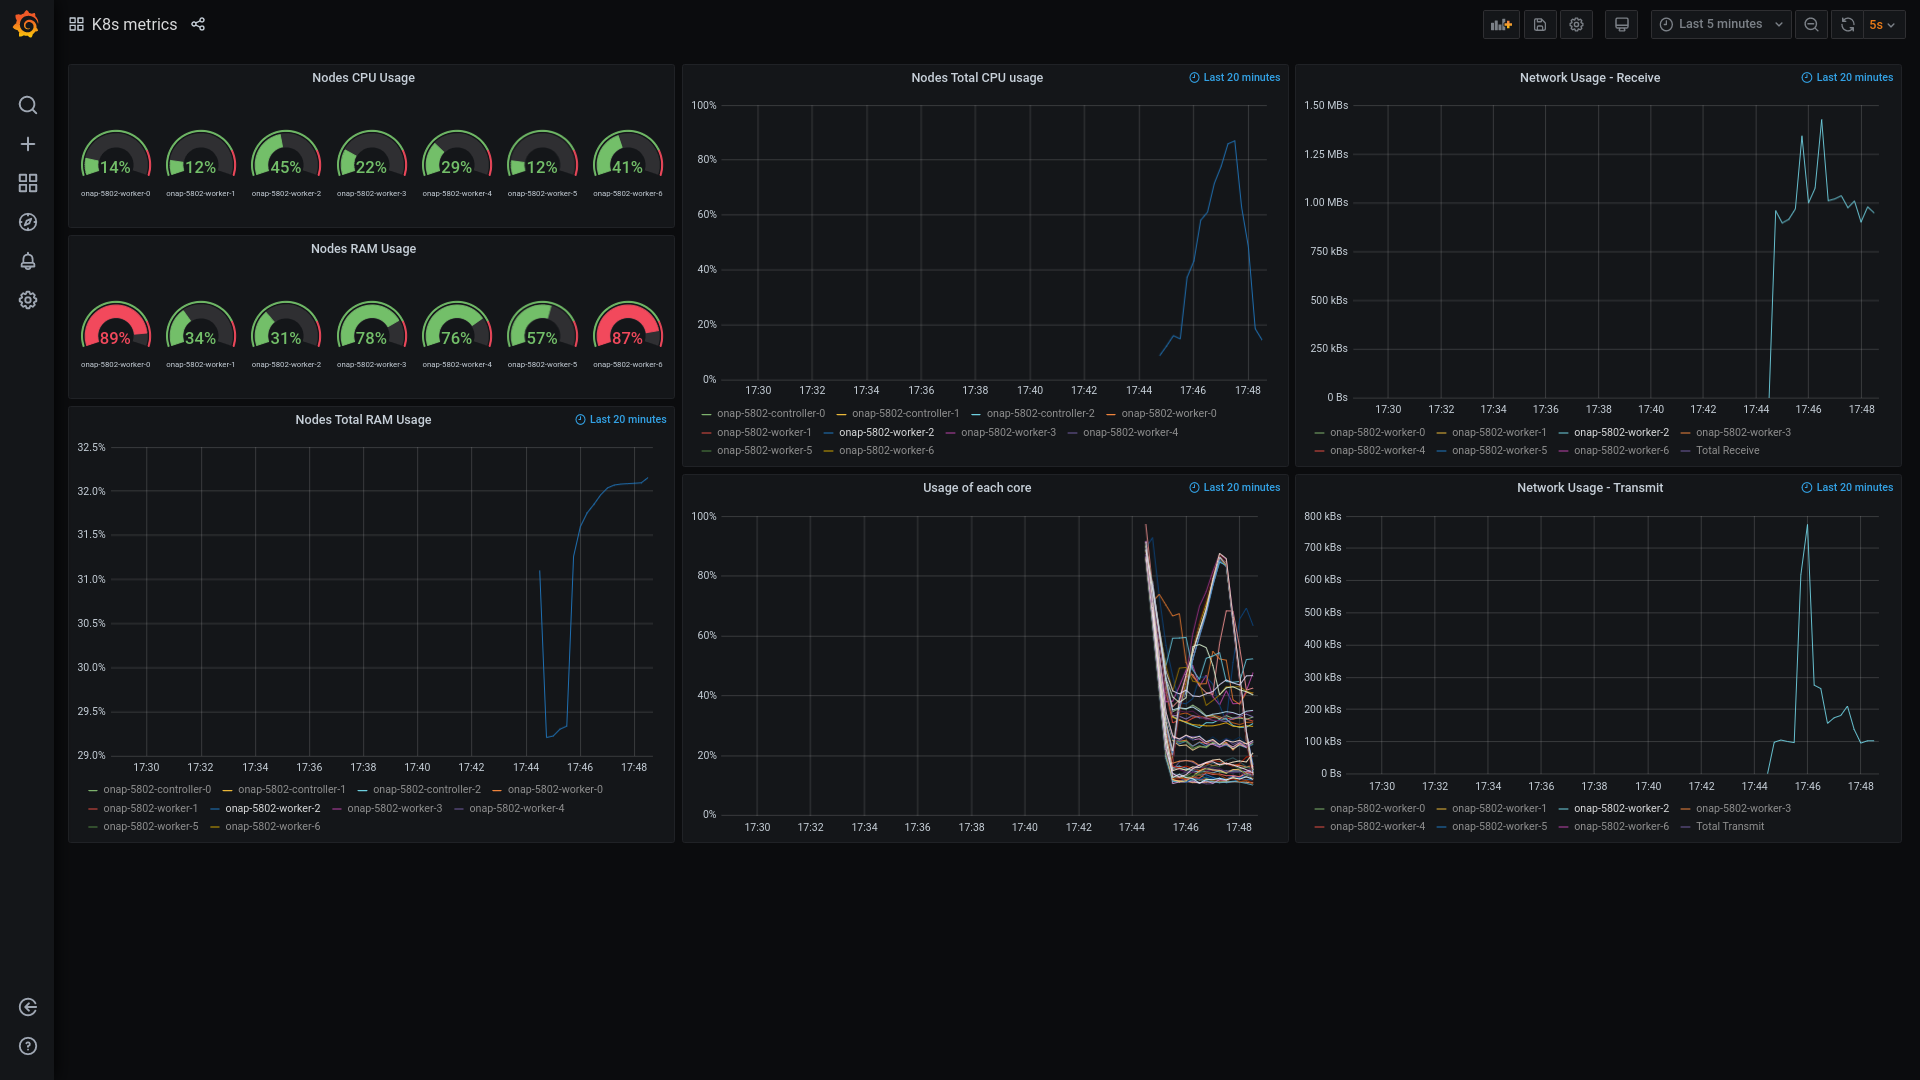
K8s metrics
- Nodes CPU Usage - current CPU usage on each worker node
- Nodes RAM Usage - current RAM usage on each worker node
- Nodes Total CPU usage - CPU usage on each node over time
- Network Usage Receive - incoming network traffic on each node in MBs
- Nodes Total RAM Usage - RAM usage on each node over time
- Usage of each core - CPU usage of each core on each worker node
- Network Usage Transmit - outgoing network traffic on each node in MBs
Results
Environment 1
- CPU - 8 cores
- CPU clock speed - 2.4 GHz
- Max Heap - 512 MB
- Start Heap - 256 MB
| Test scenario | Description | JMeter test results & metrics | Ves metrics | K8s metrics |
|---|---|---|---|---|
1_test_scenario_6_steps.jmx |
|  |  |  |
2_test_scenario_1k_rps.jmx |
|
|
|
|
2_test_scenario_2k_rps.jmx |
|
|
|
|
2_test_scenario_3k_rps.jmx |
|
|
|
|
| 2_test_scenario_4k_rps.jmx |
|
|
|
|
2_test_scenario_5k_rps.jmx |
|
|
|
|
| custom |
|
|
|
|
| custom |
|  |
|
|
| custom |
|
|
|
|
| custom |
|
|  |
|
| custom |
|
|
|
|


Environment 2
- CPU - 24 cores
- CPU clock speed - 2.4 GHz
- Max Heap - 512 MB
- Start Heap - 256 MB
| Test scenario |
|---|
| Test scenario | Description | JMeter test results & metrics | Ves metrics | K8s metrics |
|---|---|---|---|---|
| custom |
|
|
|
|
| custom |
|
|
|
|